Quarto Dashboards
Hi!
My name is Isabella Velásquez.

How does Quarto work?
---
title: "ggplot2 demo"
format:
html:
code-fold: true
---
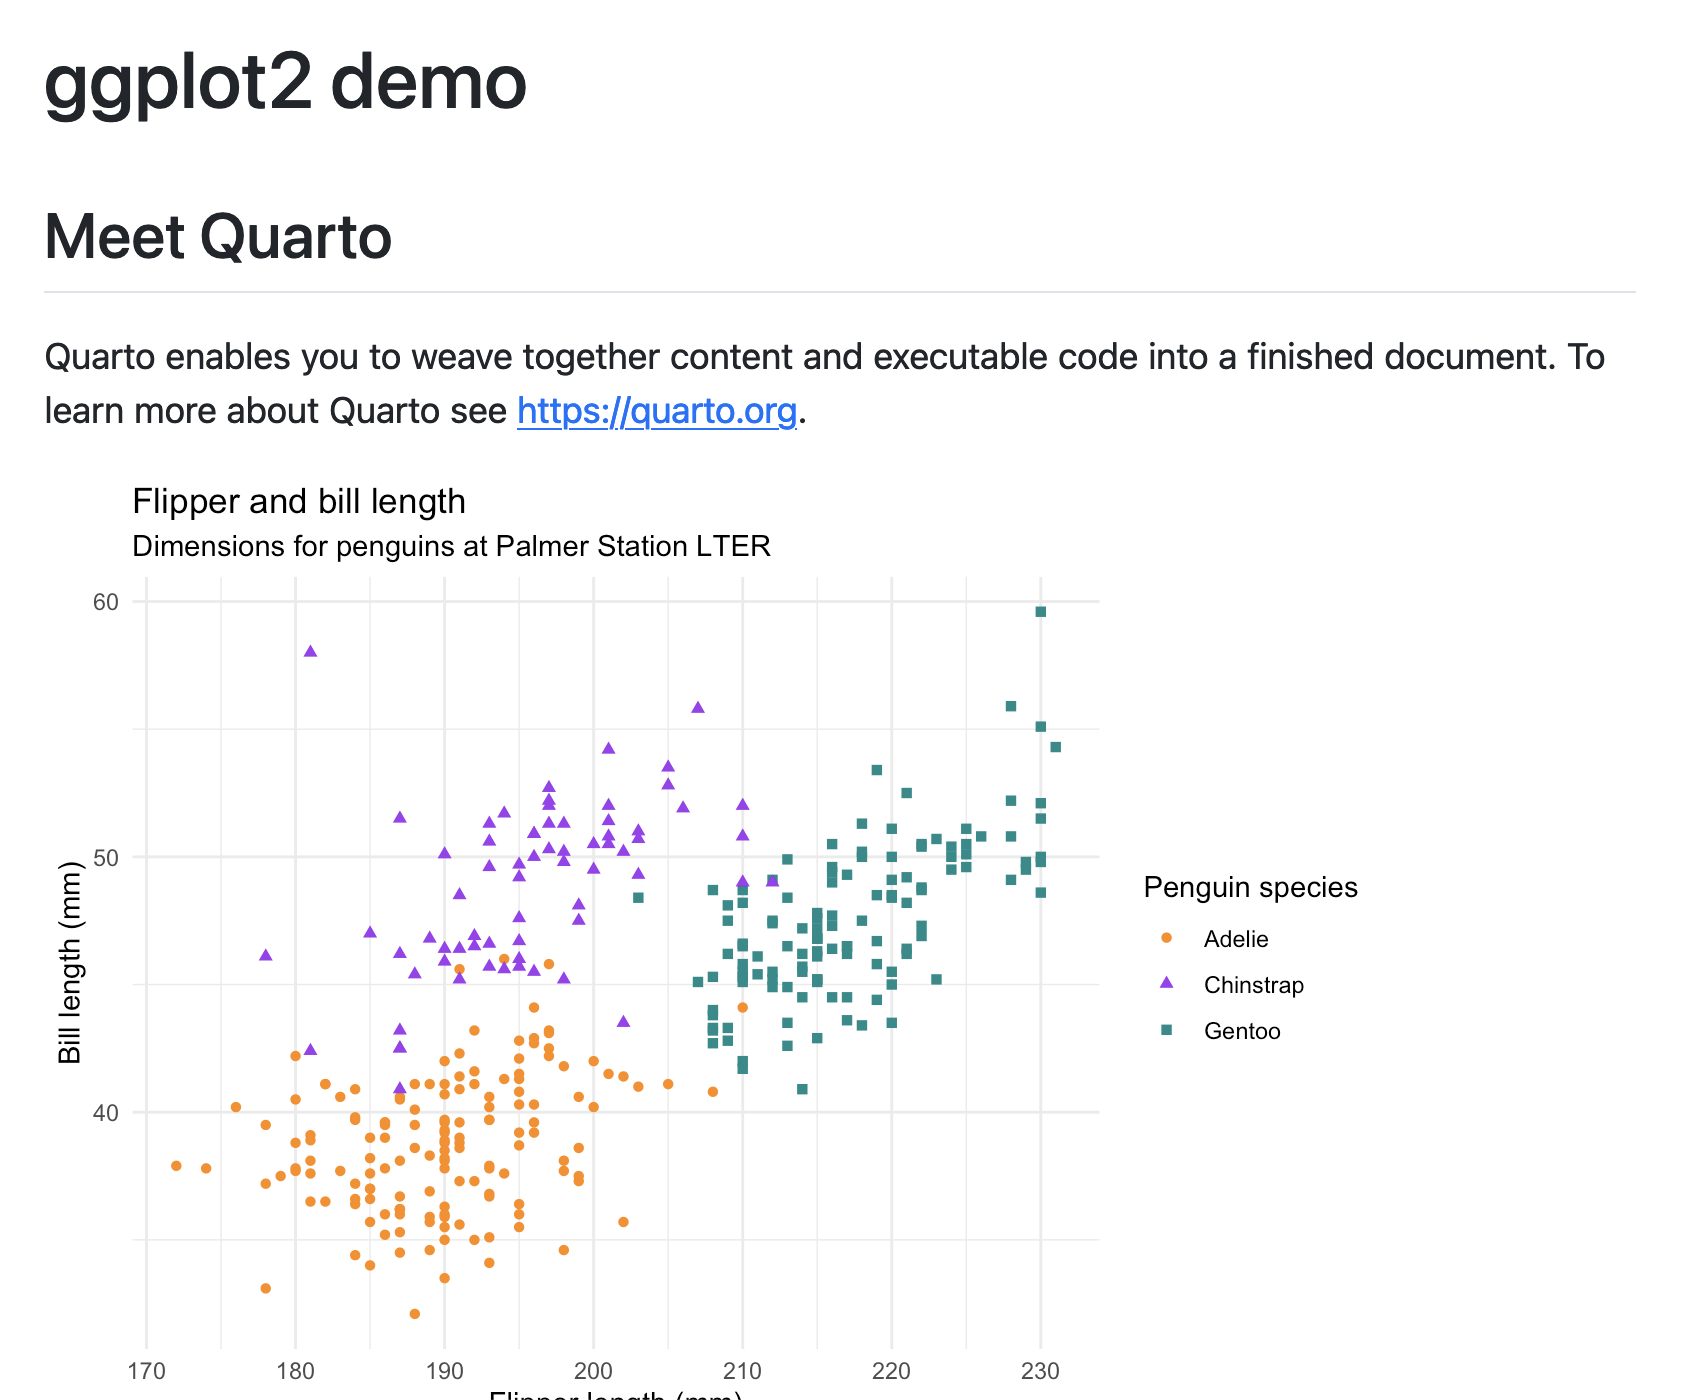
## Meet Quarto
Quarto enables you to weave together content and executable code into a finished document. To learn more about Quarto see <https://quarto.org>.
```{r}
#| label: plot-penguins
#| echo: false
#| message: false
#| warning: false
library(tidyverse)
library(palmerpenguins)
ggplot(penguins,
aes(x = flipper_length_mm, y = bill_length_mm)) +
geom_point(aes(color = species, shape = species)) +
scale_color_manual(values = c("darkorange","purple","cyan4")) +
labs(
title = "Flipper and bill length",
subtitle = "Dimensions for penguins at Palmer Station LTER",
x = "Flipper length (mm)", y = "Bill length (mm)",
color = "Penguin species", shape = "Penguin species"
) +
theme_minimal()
```
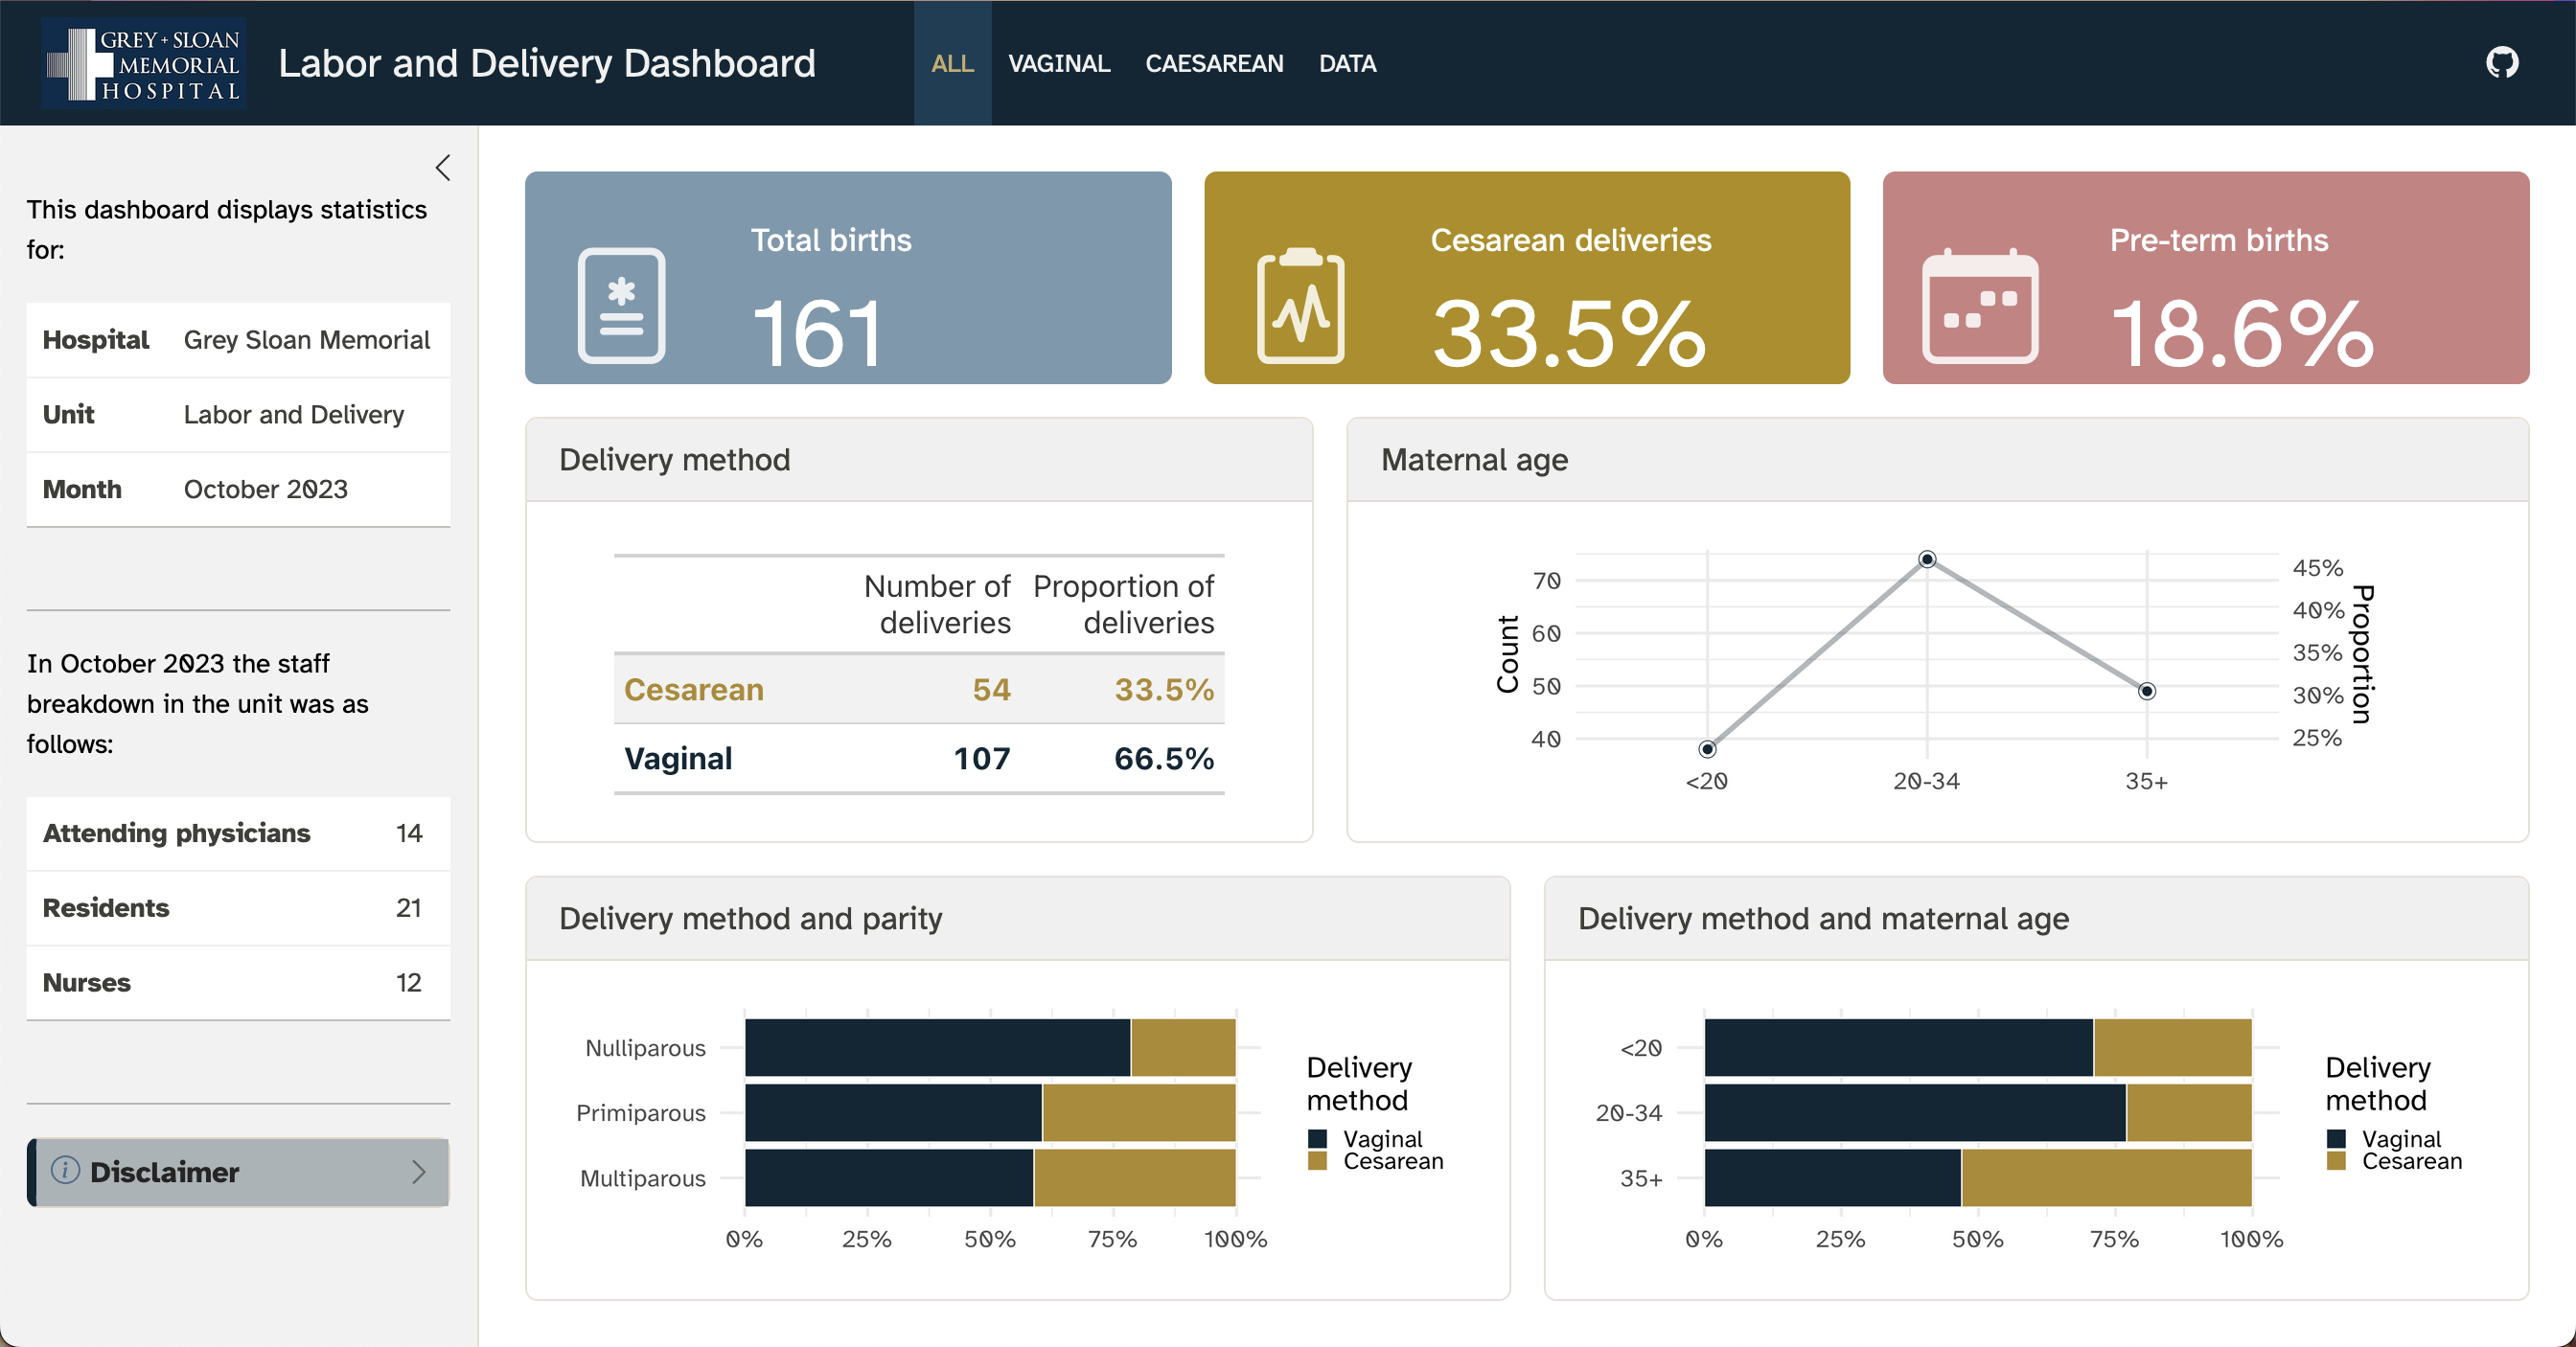
What can you build with Quarto?
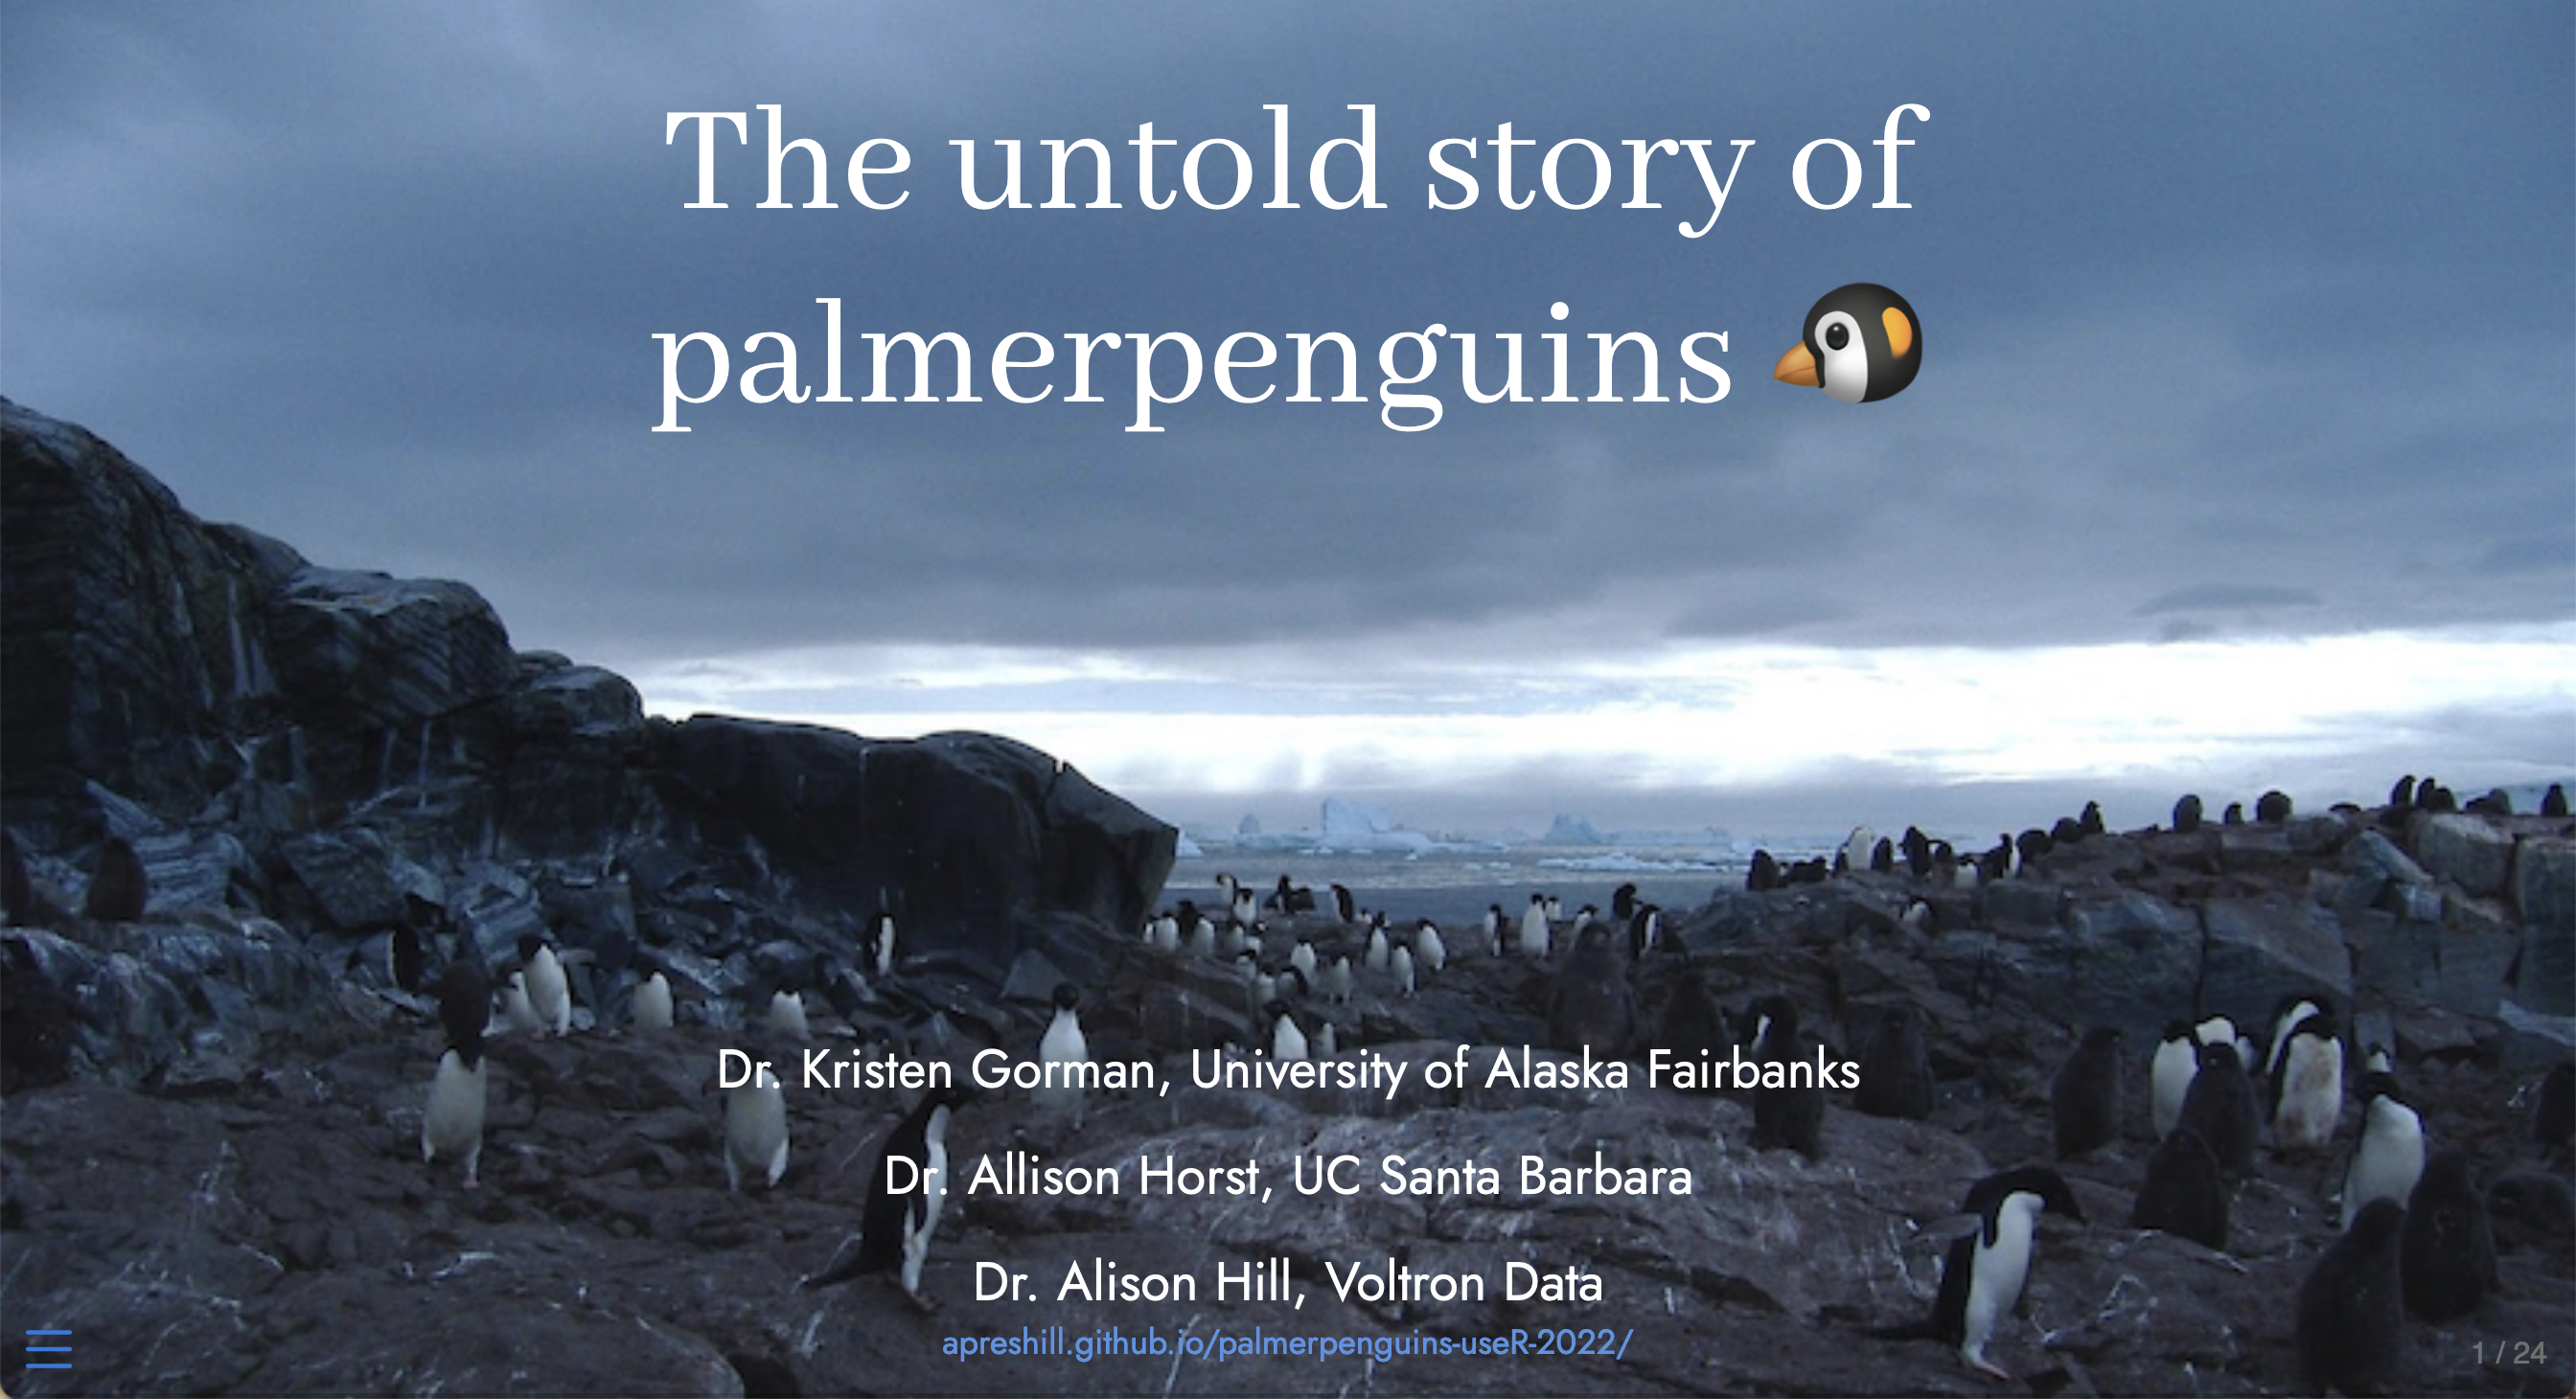
Dr. Alison Hill

Learn more about Quarto
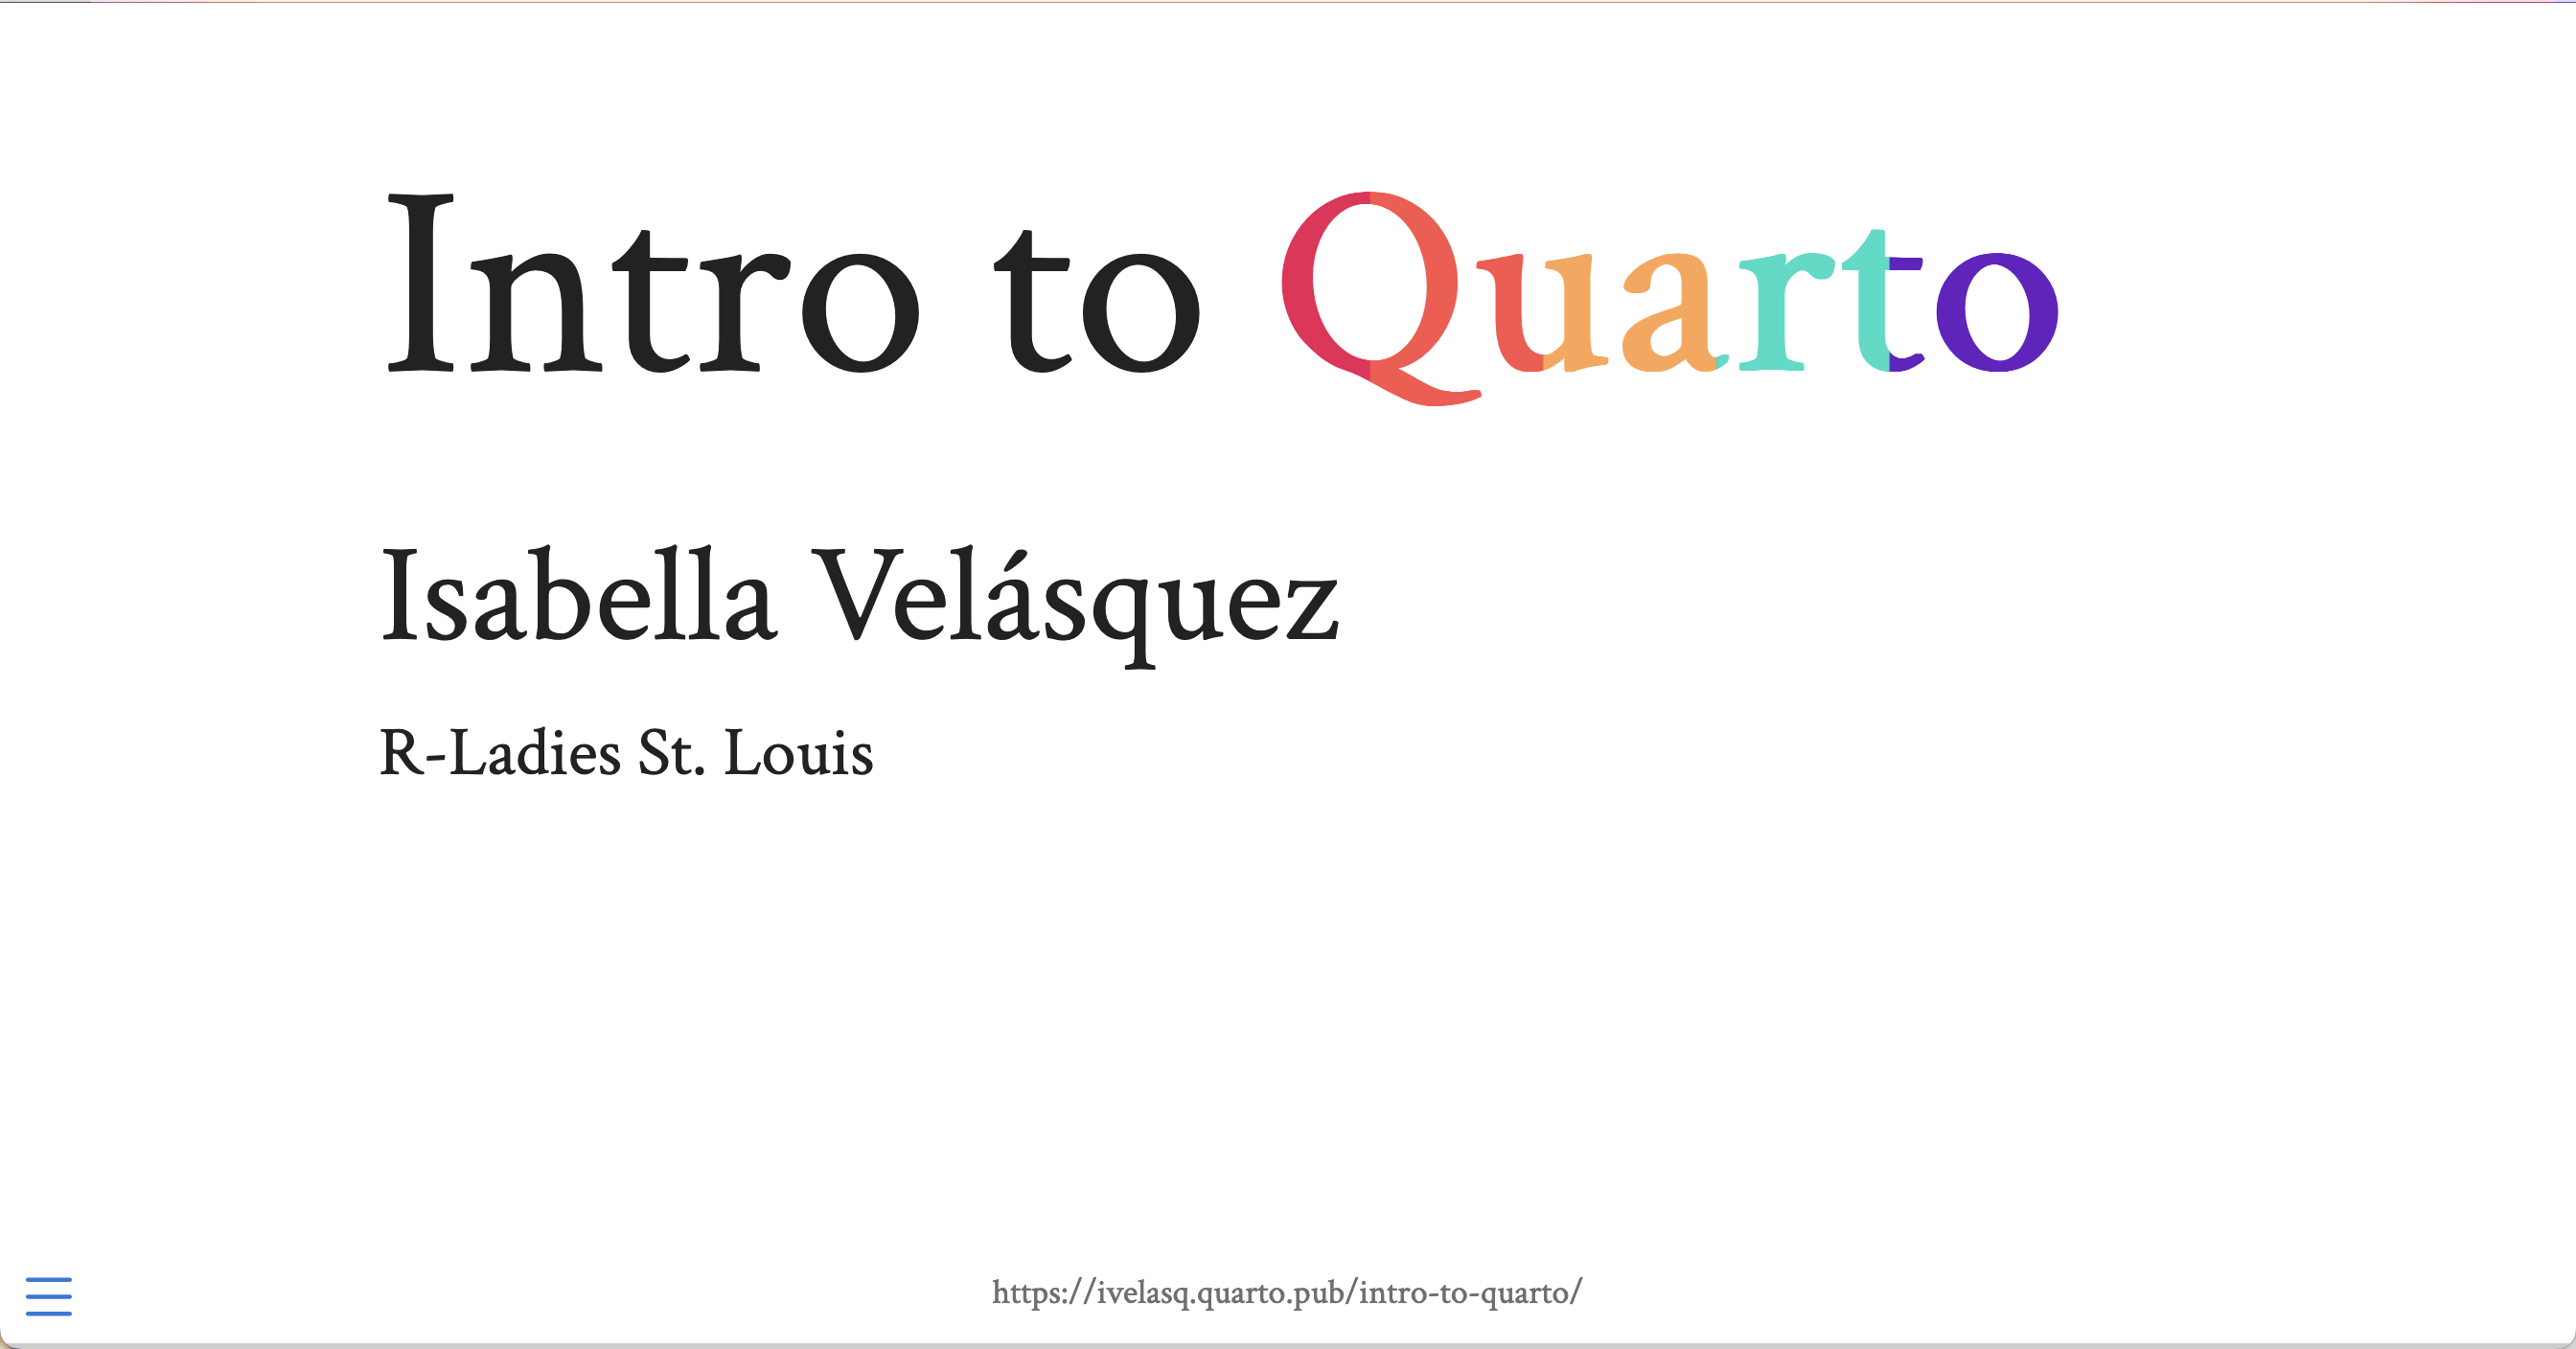
Intro to Quarto - Isabella Velásquez
Learn more about Quarto

Building a Website in R - Federica Gazzelloni
Learn more about Quarto

Branded Quarto - Emil Hvitfeldt
Quarto Dashboards
Goal is to make it simple to build compelling interactive dashboards using R, Python, Julia, and Observable.

https://quarto.org/docs/dashboards/examples/
Start from Scratch
Add a card:
Start from scratch
Continue adding cards:
Start from Scratch
Add a title to your cards:
Rows
By default, cards are laid out in rows:
Rows
By default, cards are laid out in rows:
Columns
We can change it to be columns instead:

Headings
Alternatively, we can use headings to arrange cards:
Headings
Make another row with content:
Headings
Continue adding content:
Headings
We can add columns within our rows:
Tabsets
Or use tabsets to put content in different tabs:
Tabsets
Pages
Use a Level 1 heading to create new pages:
Pages
Use a Level 1 heading to create new pages:
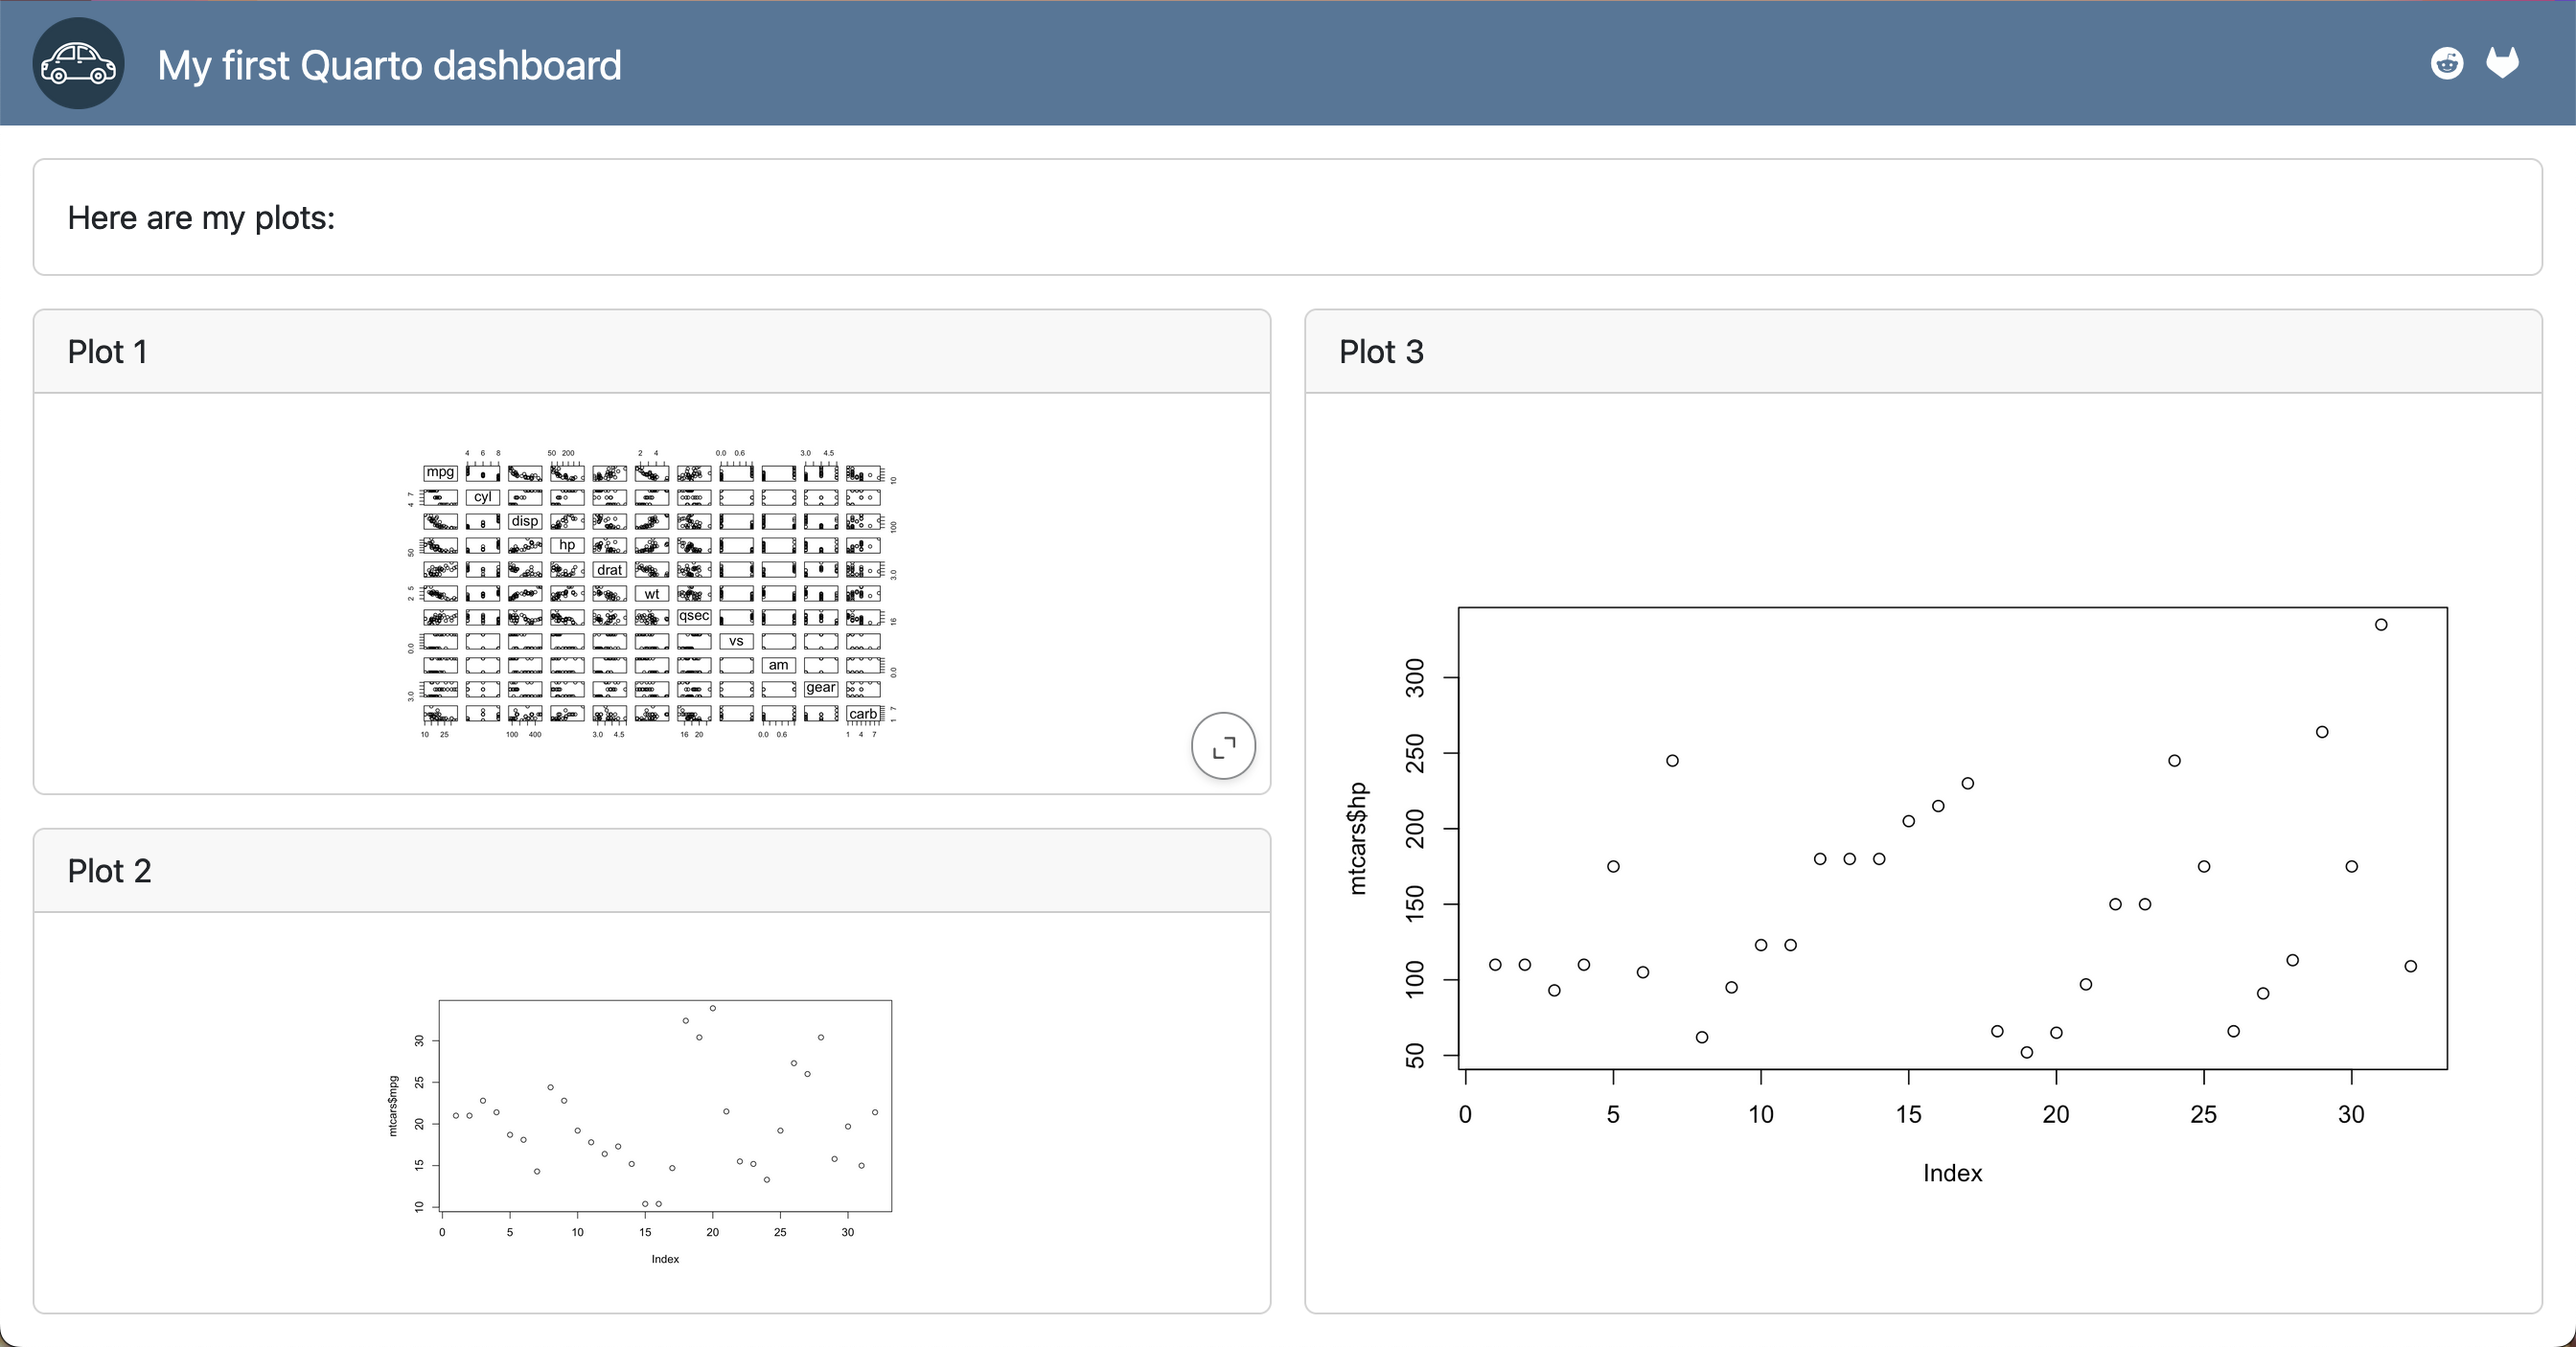
Navigation
Add a logo and buttons to your navigation bar:
dashboard.qmd
---
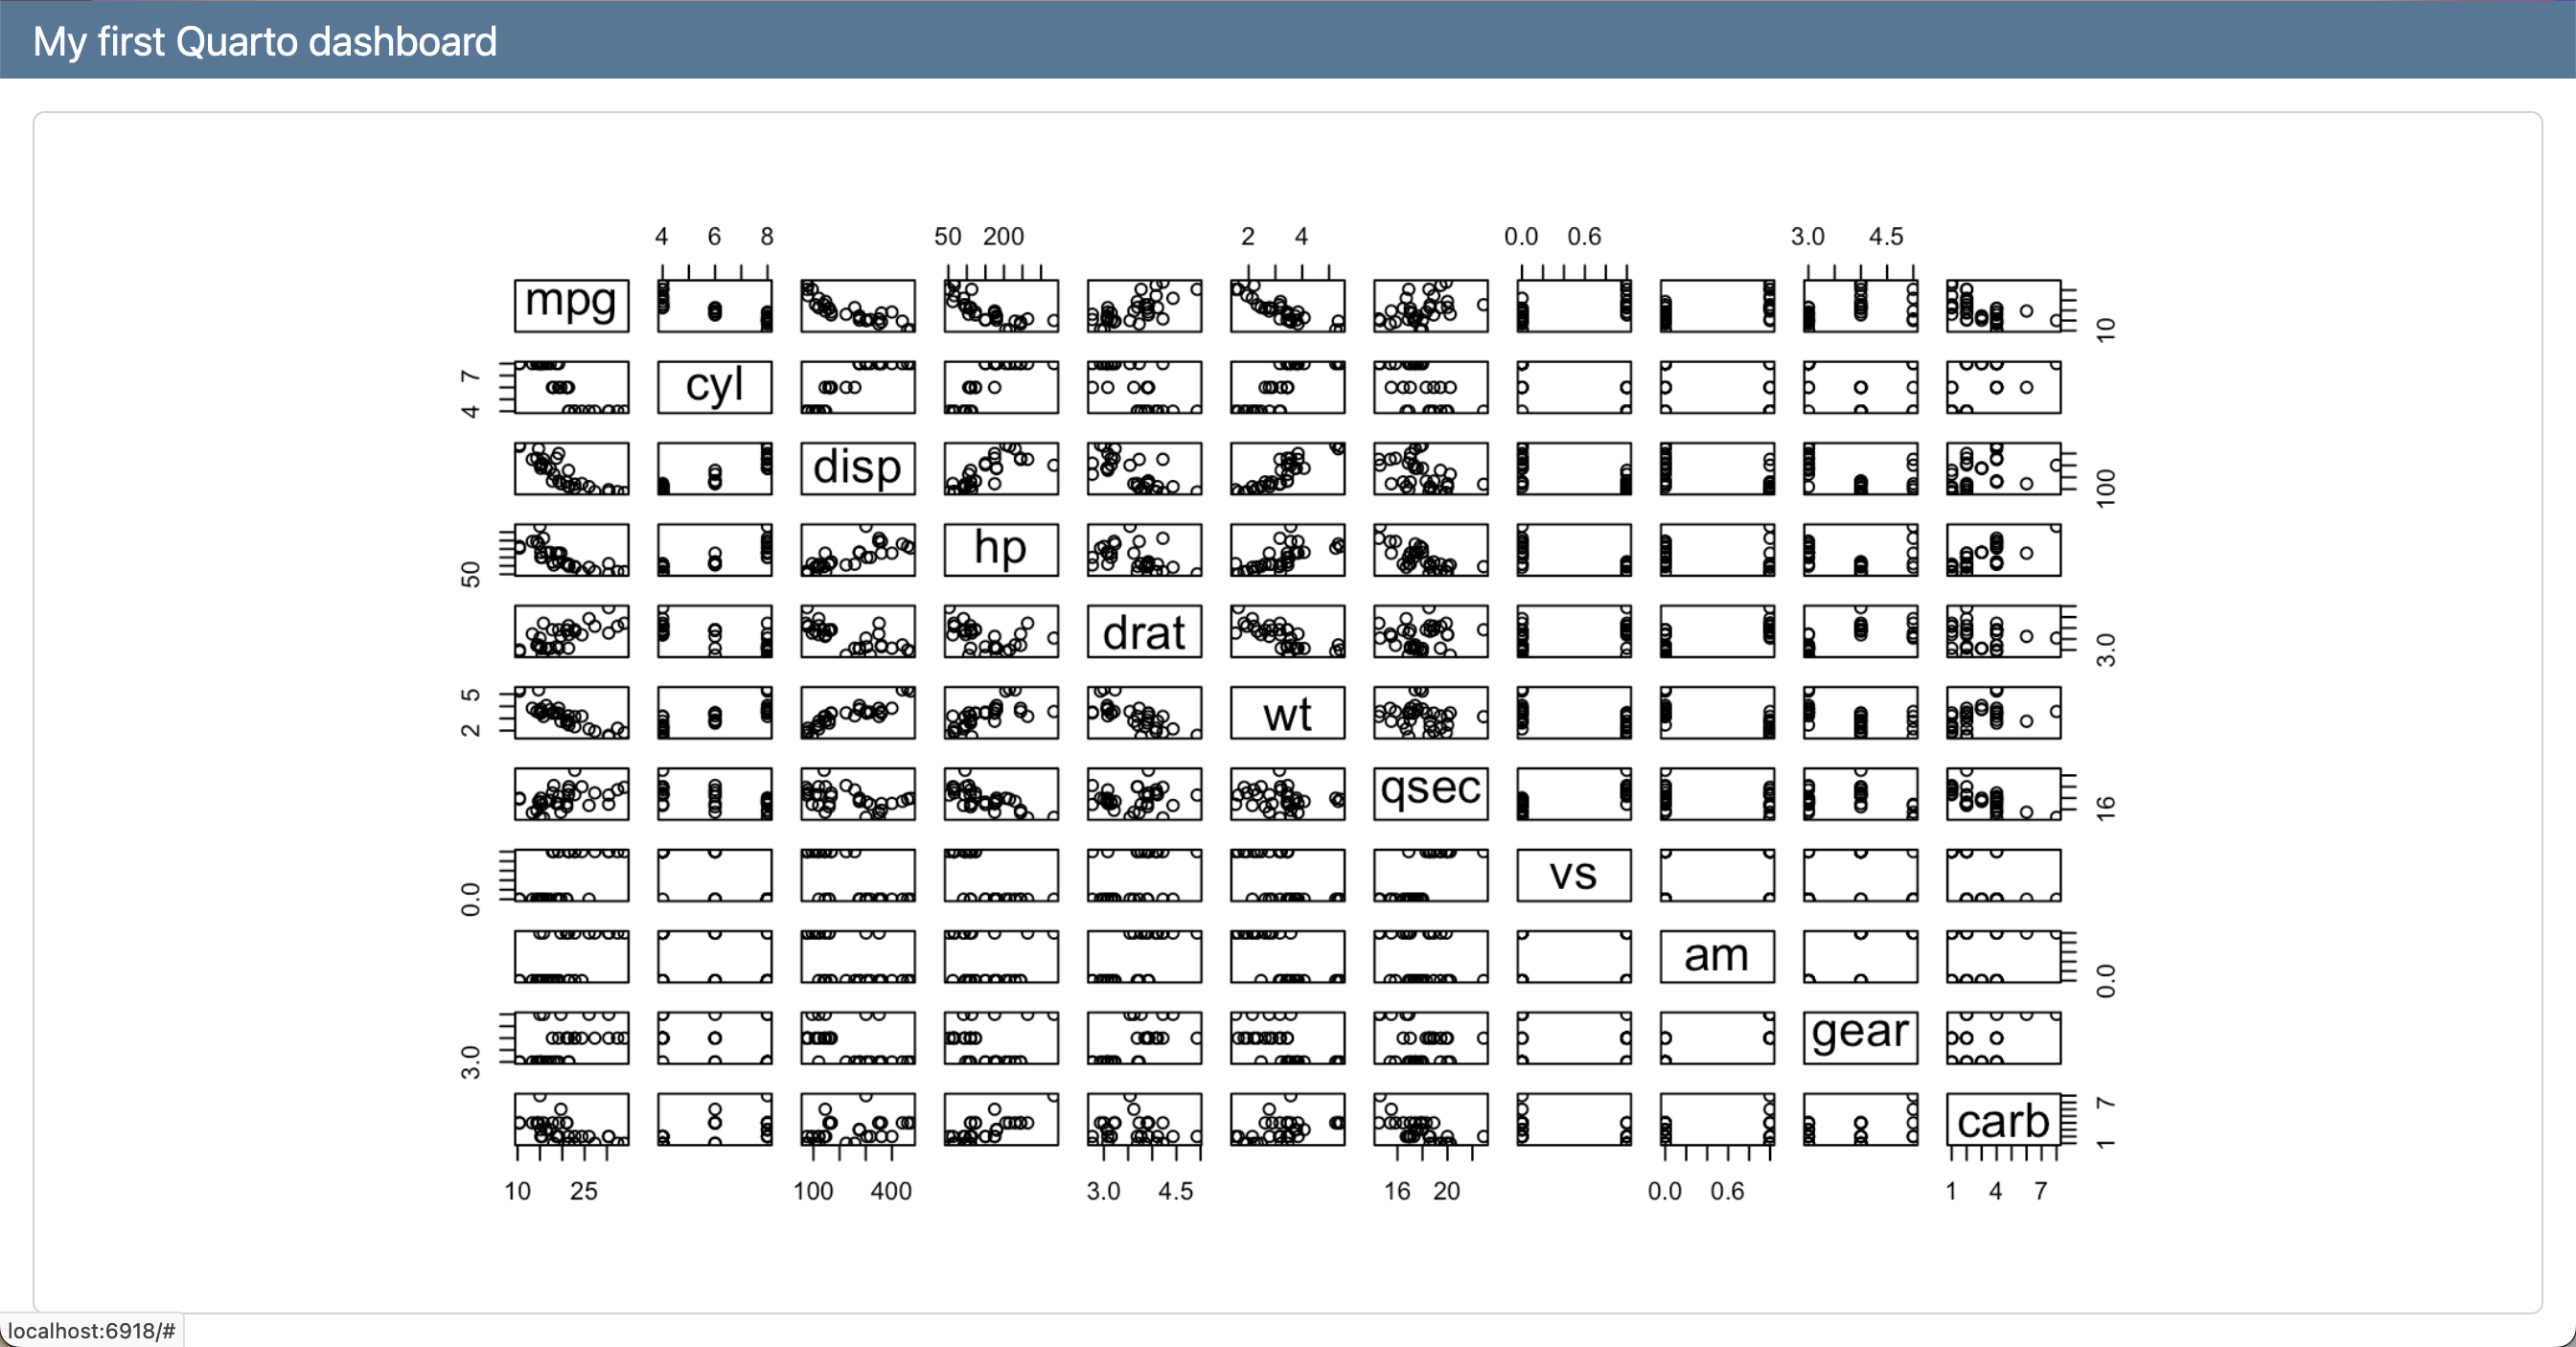
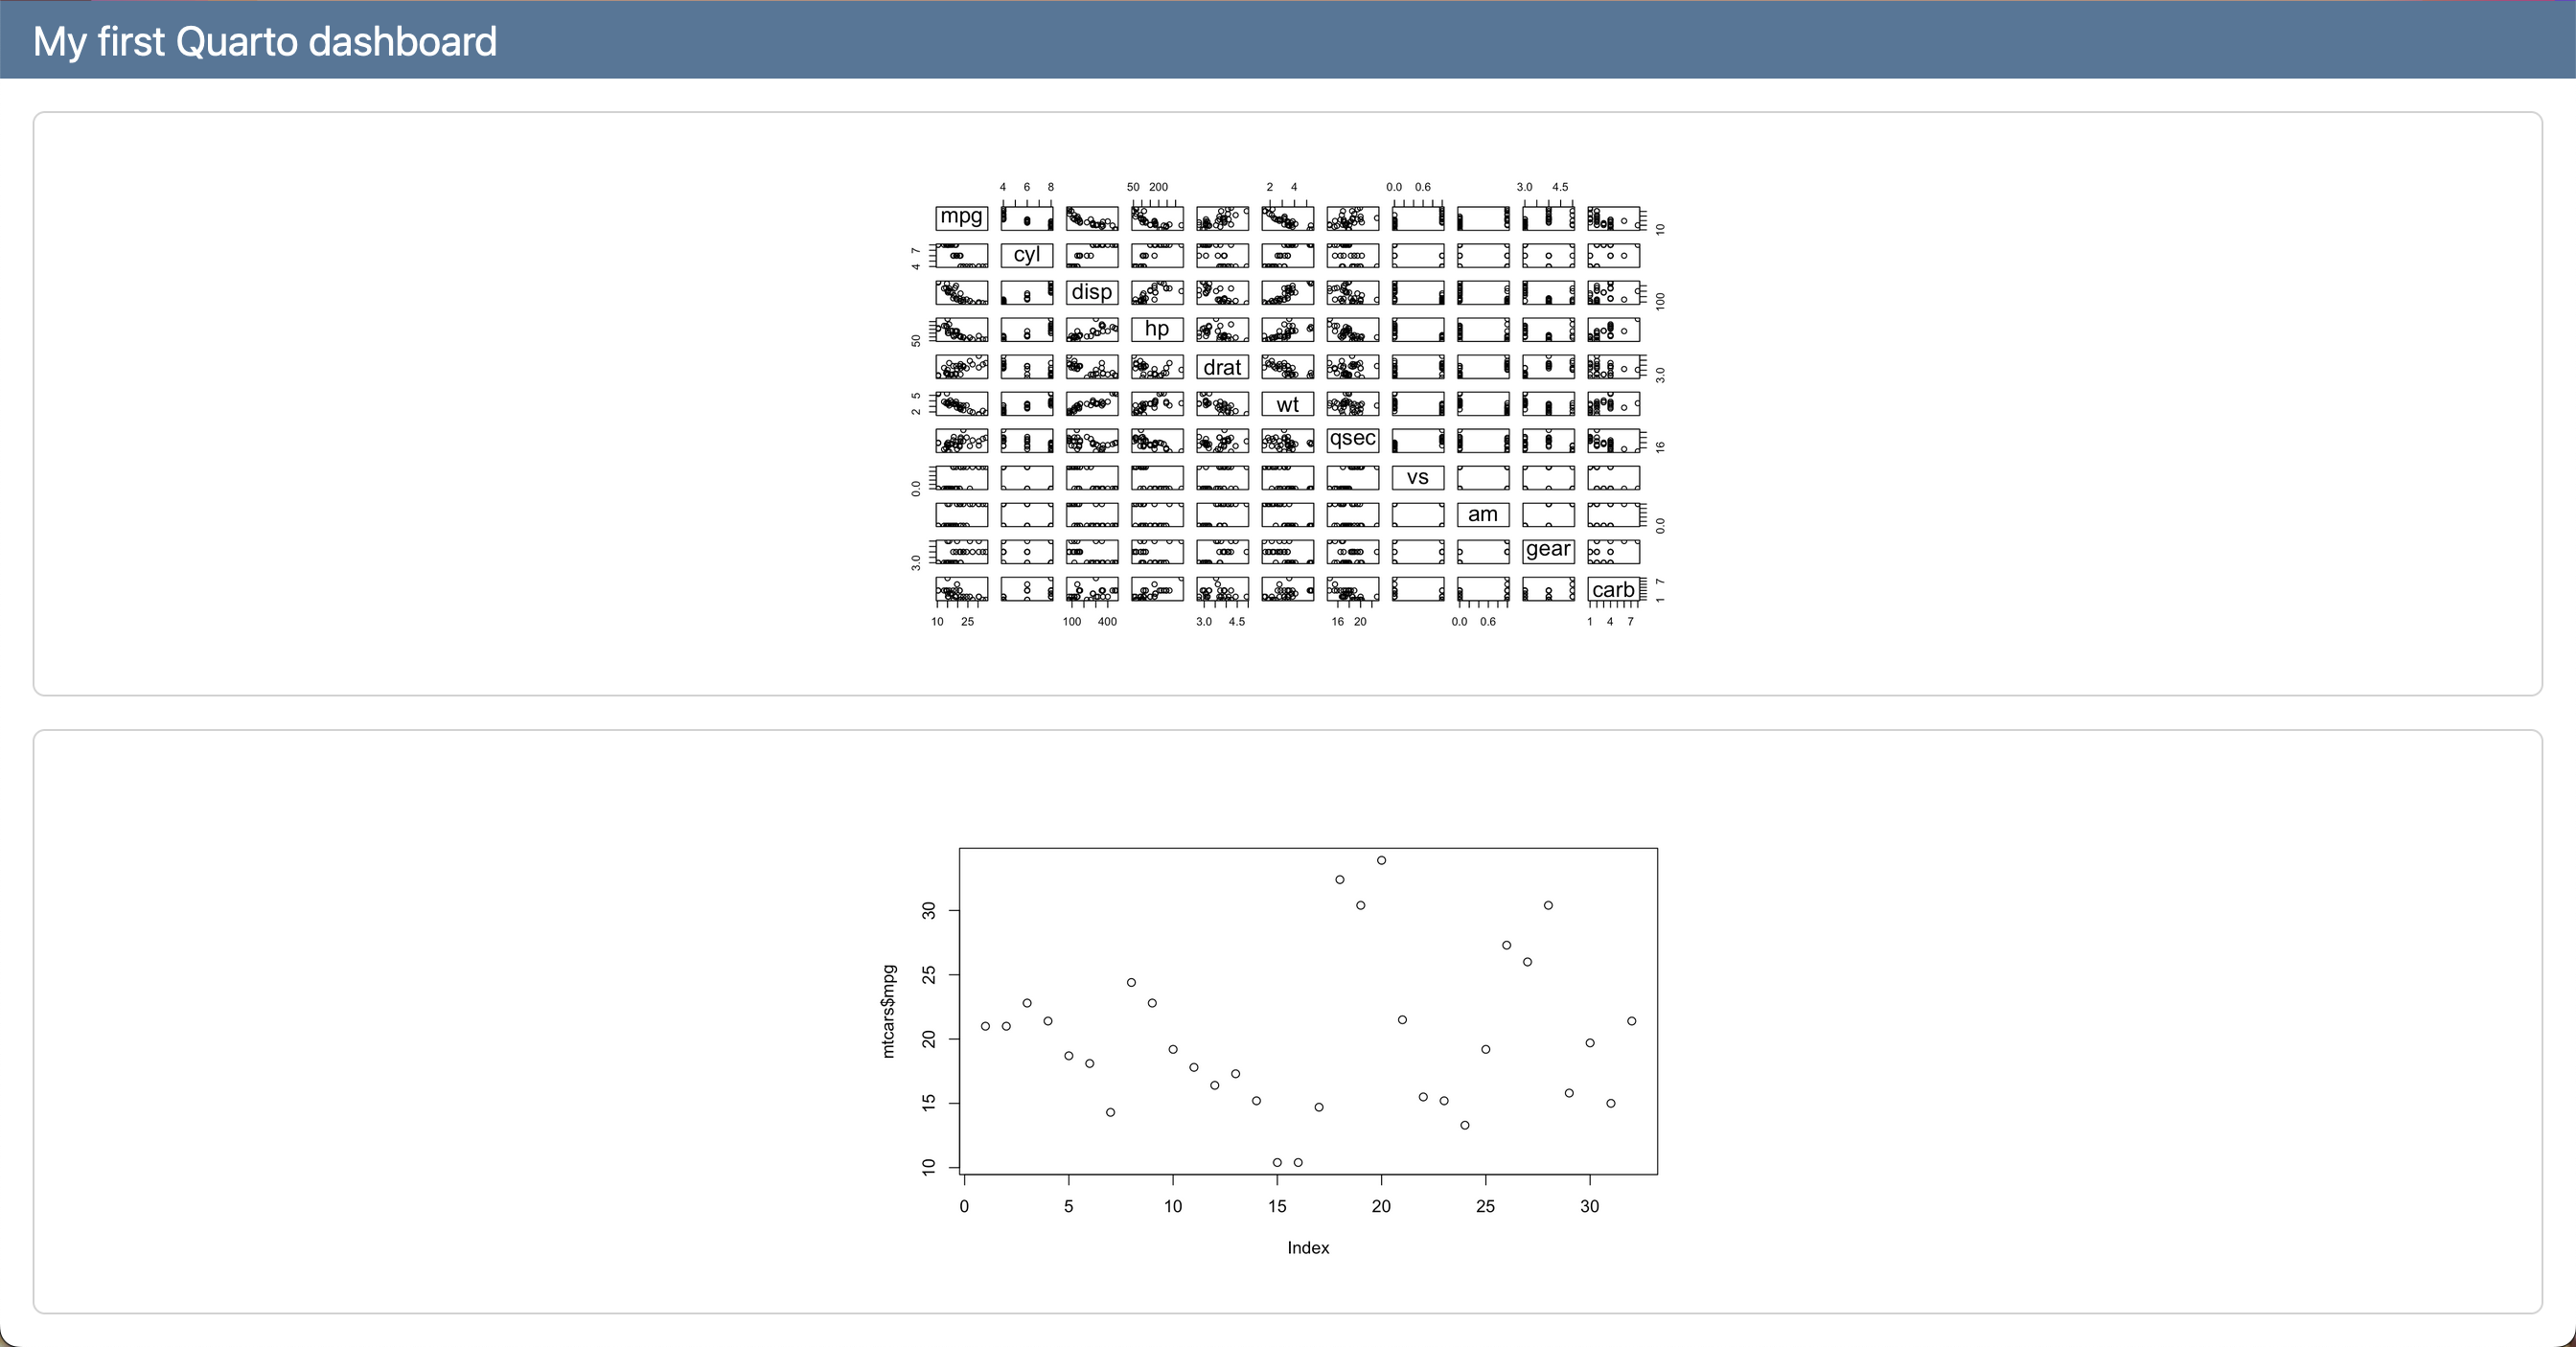
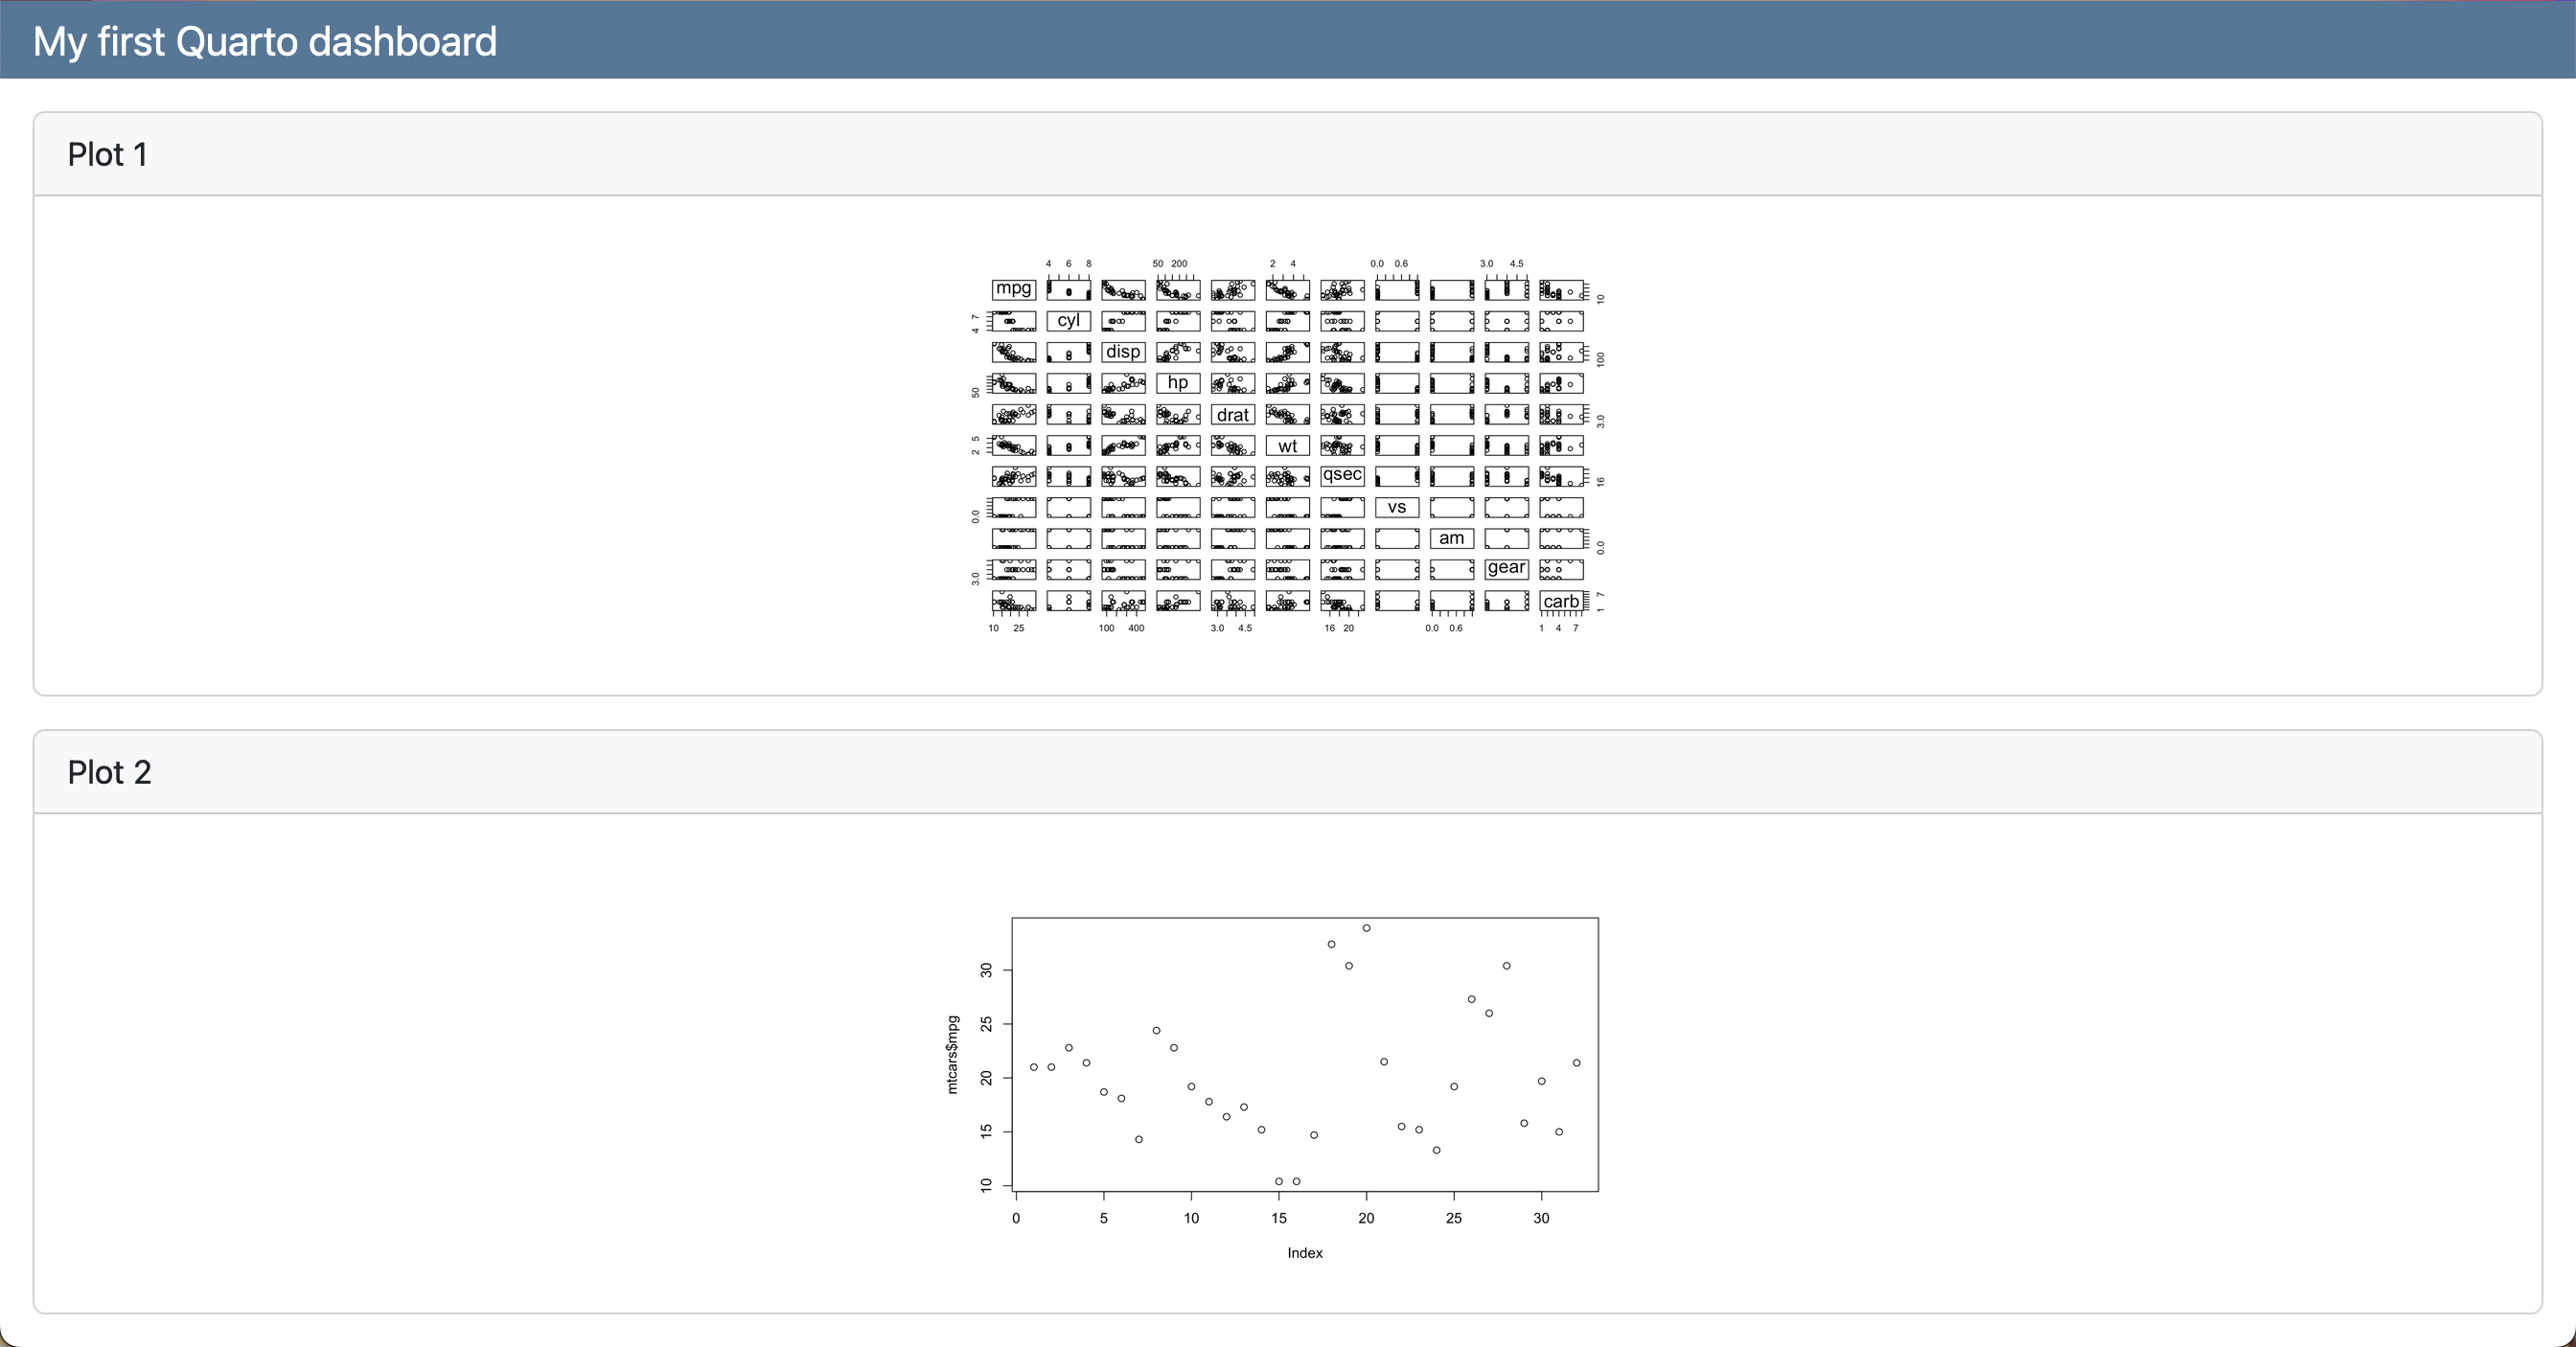
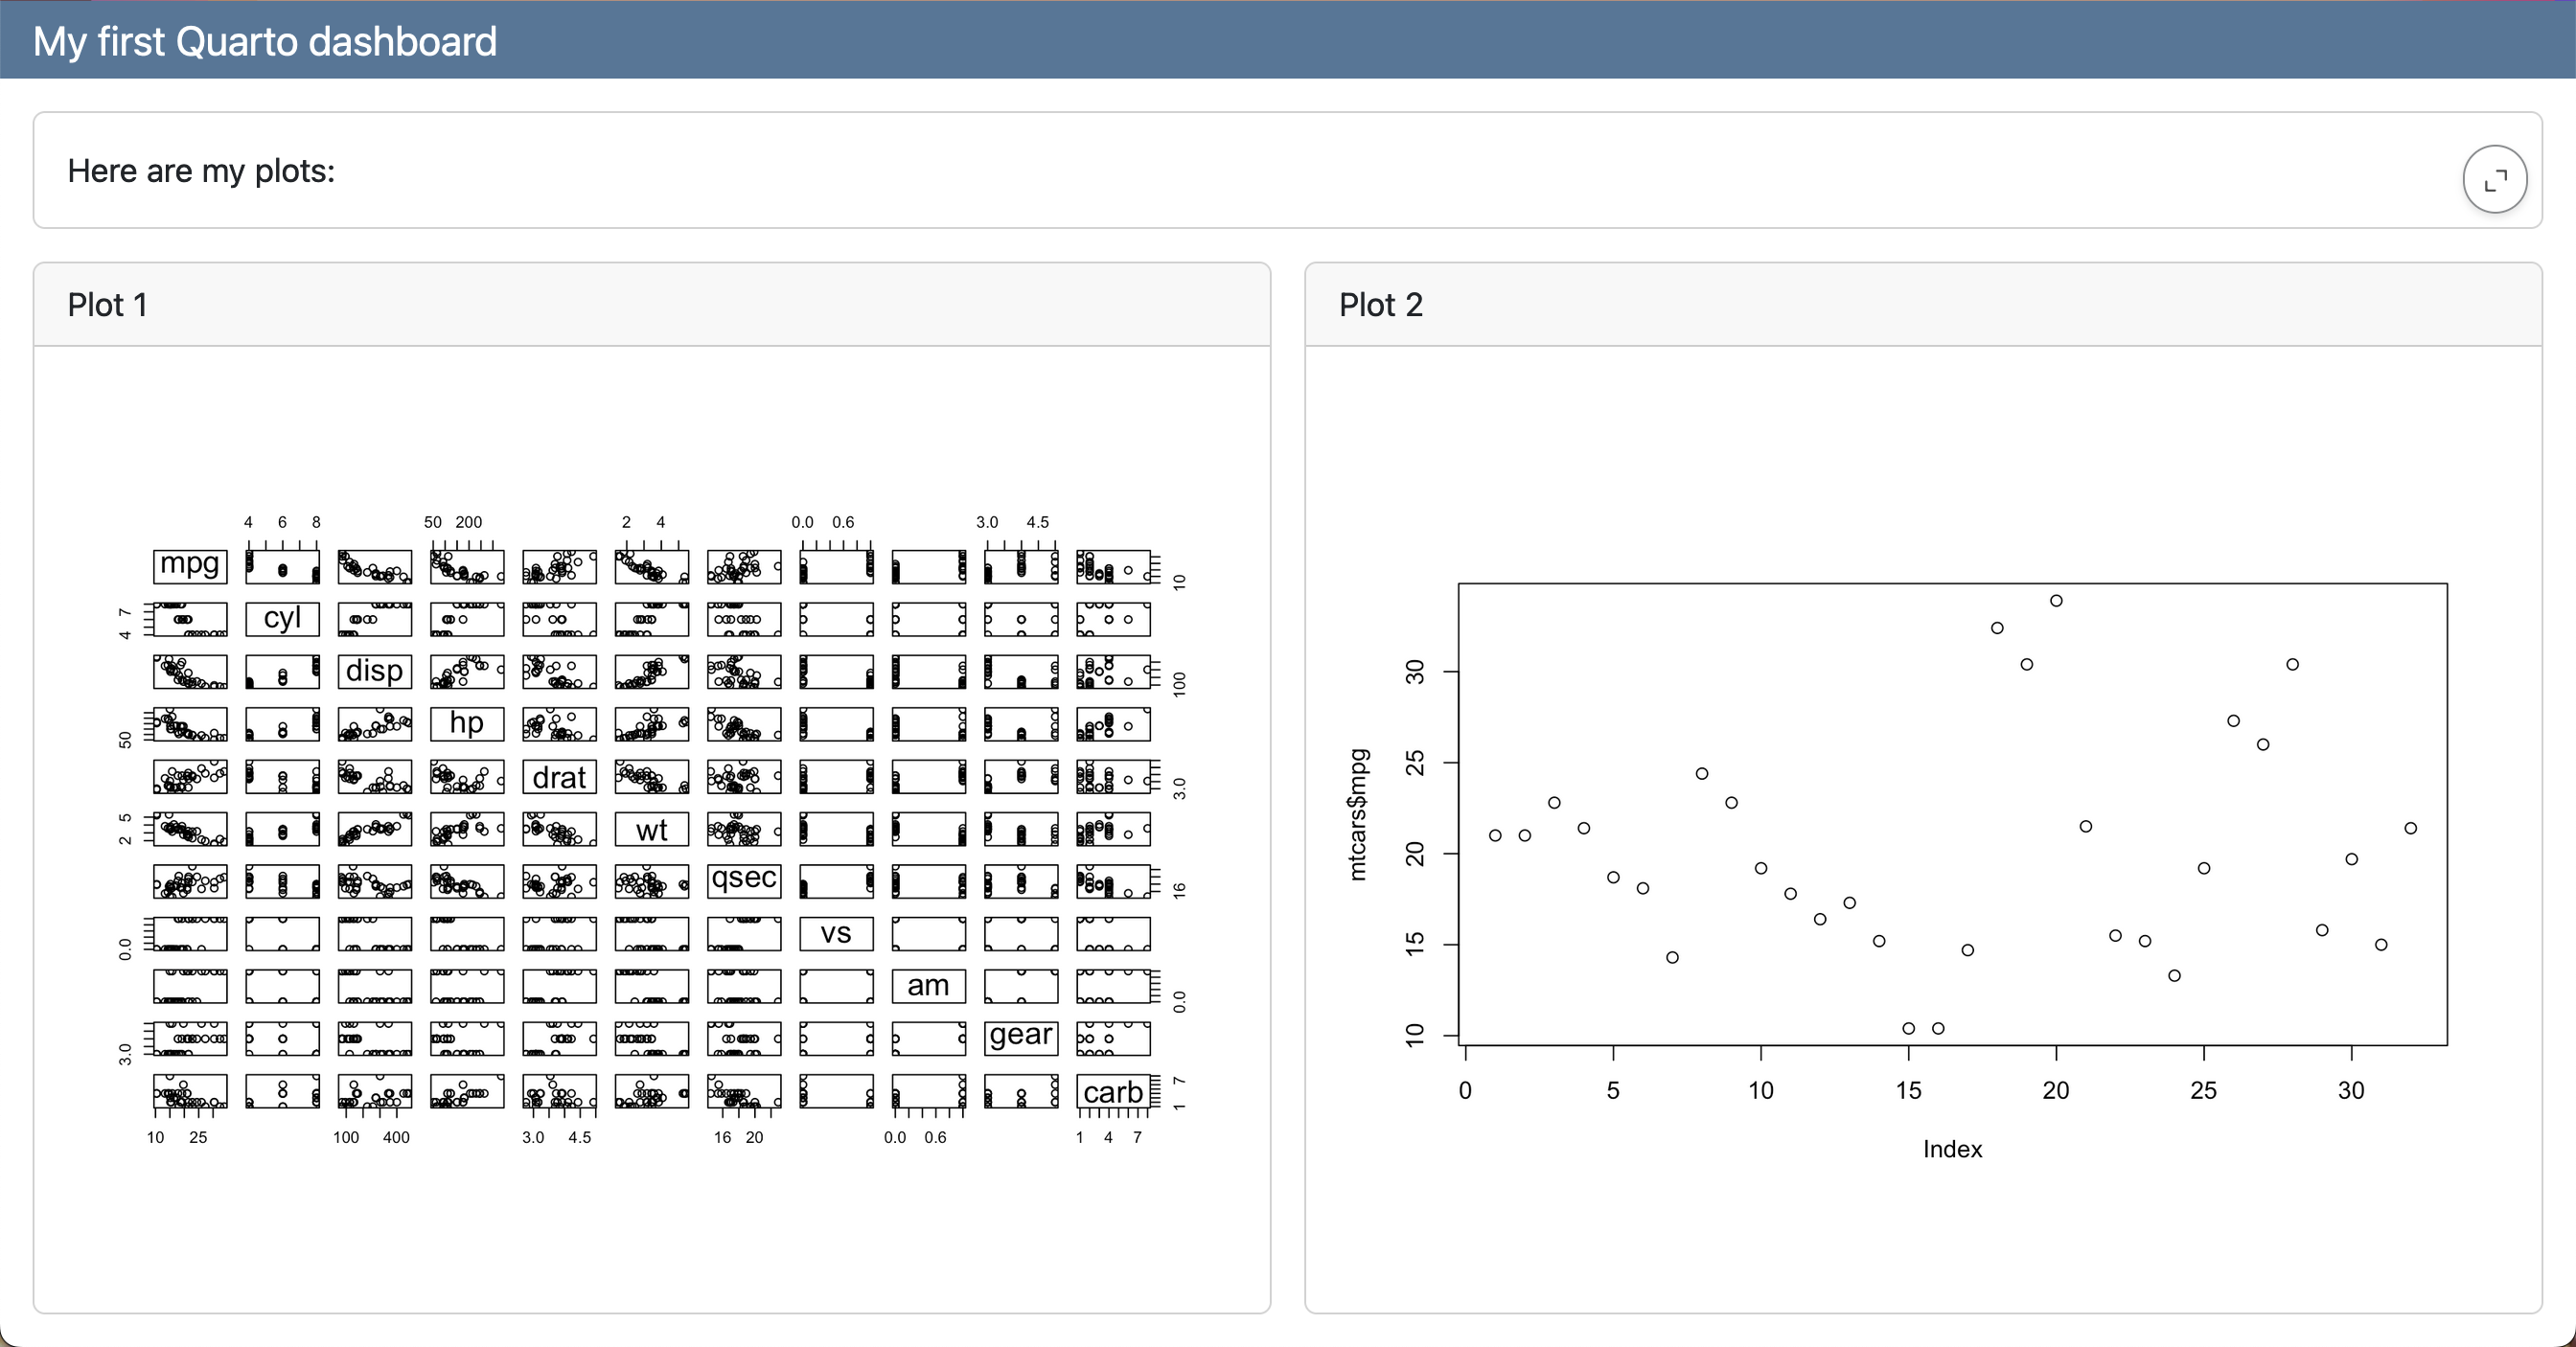
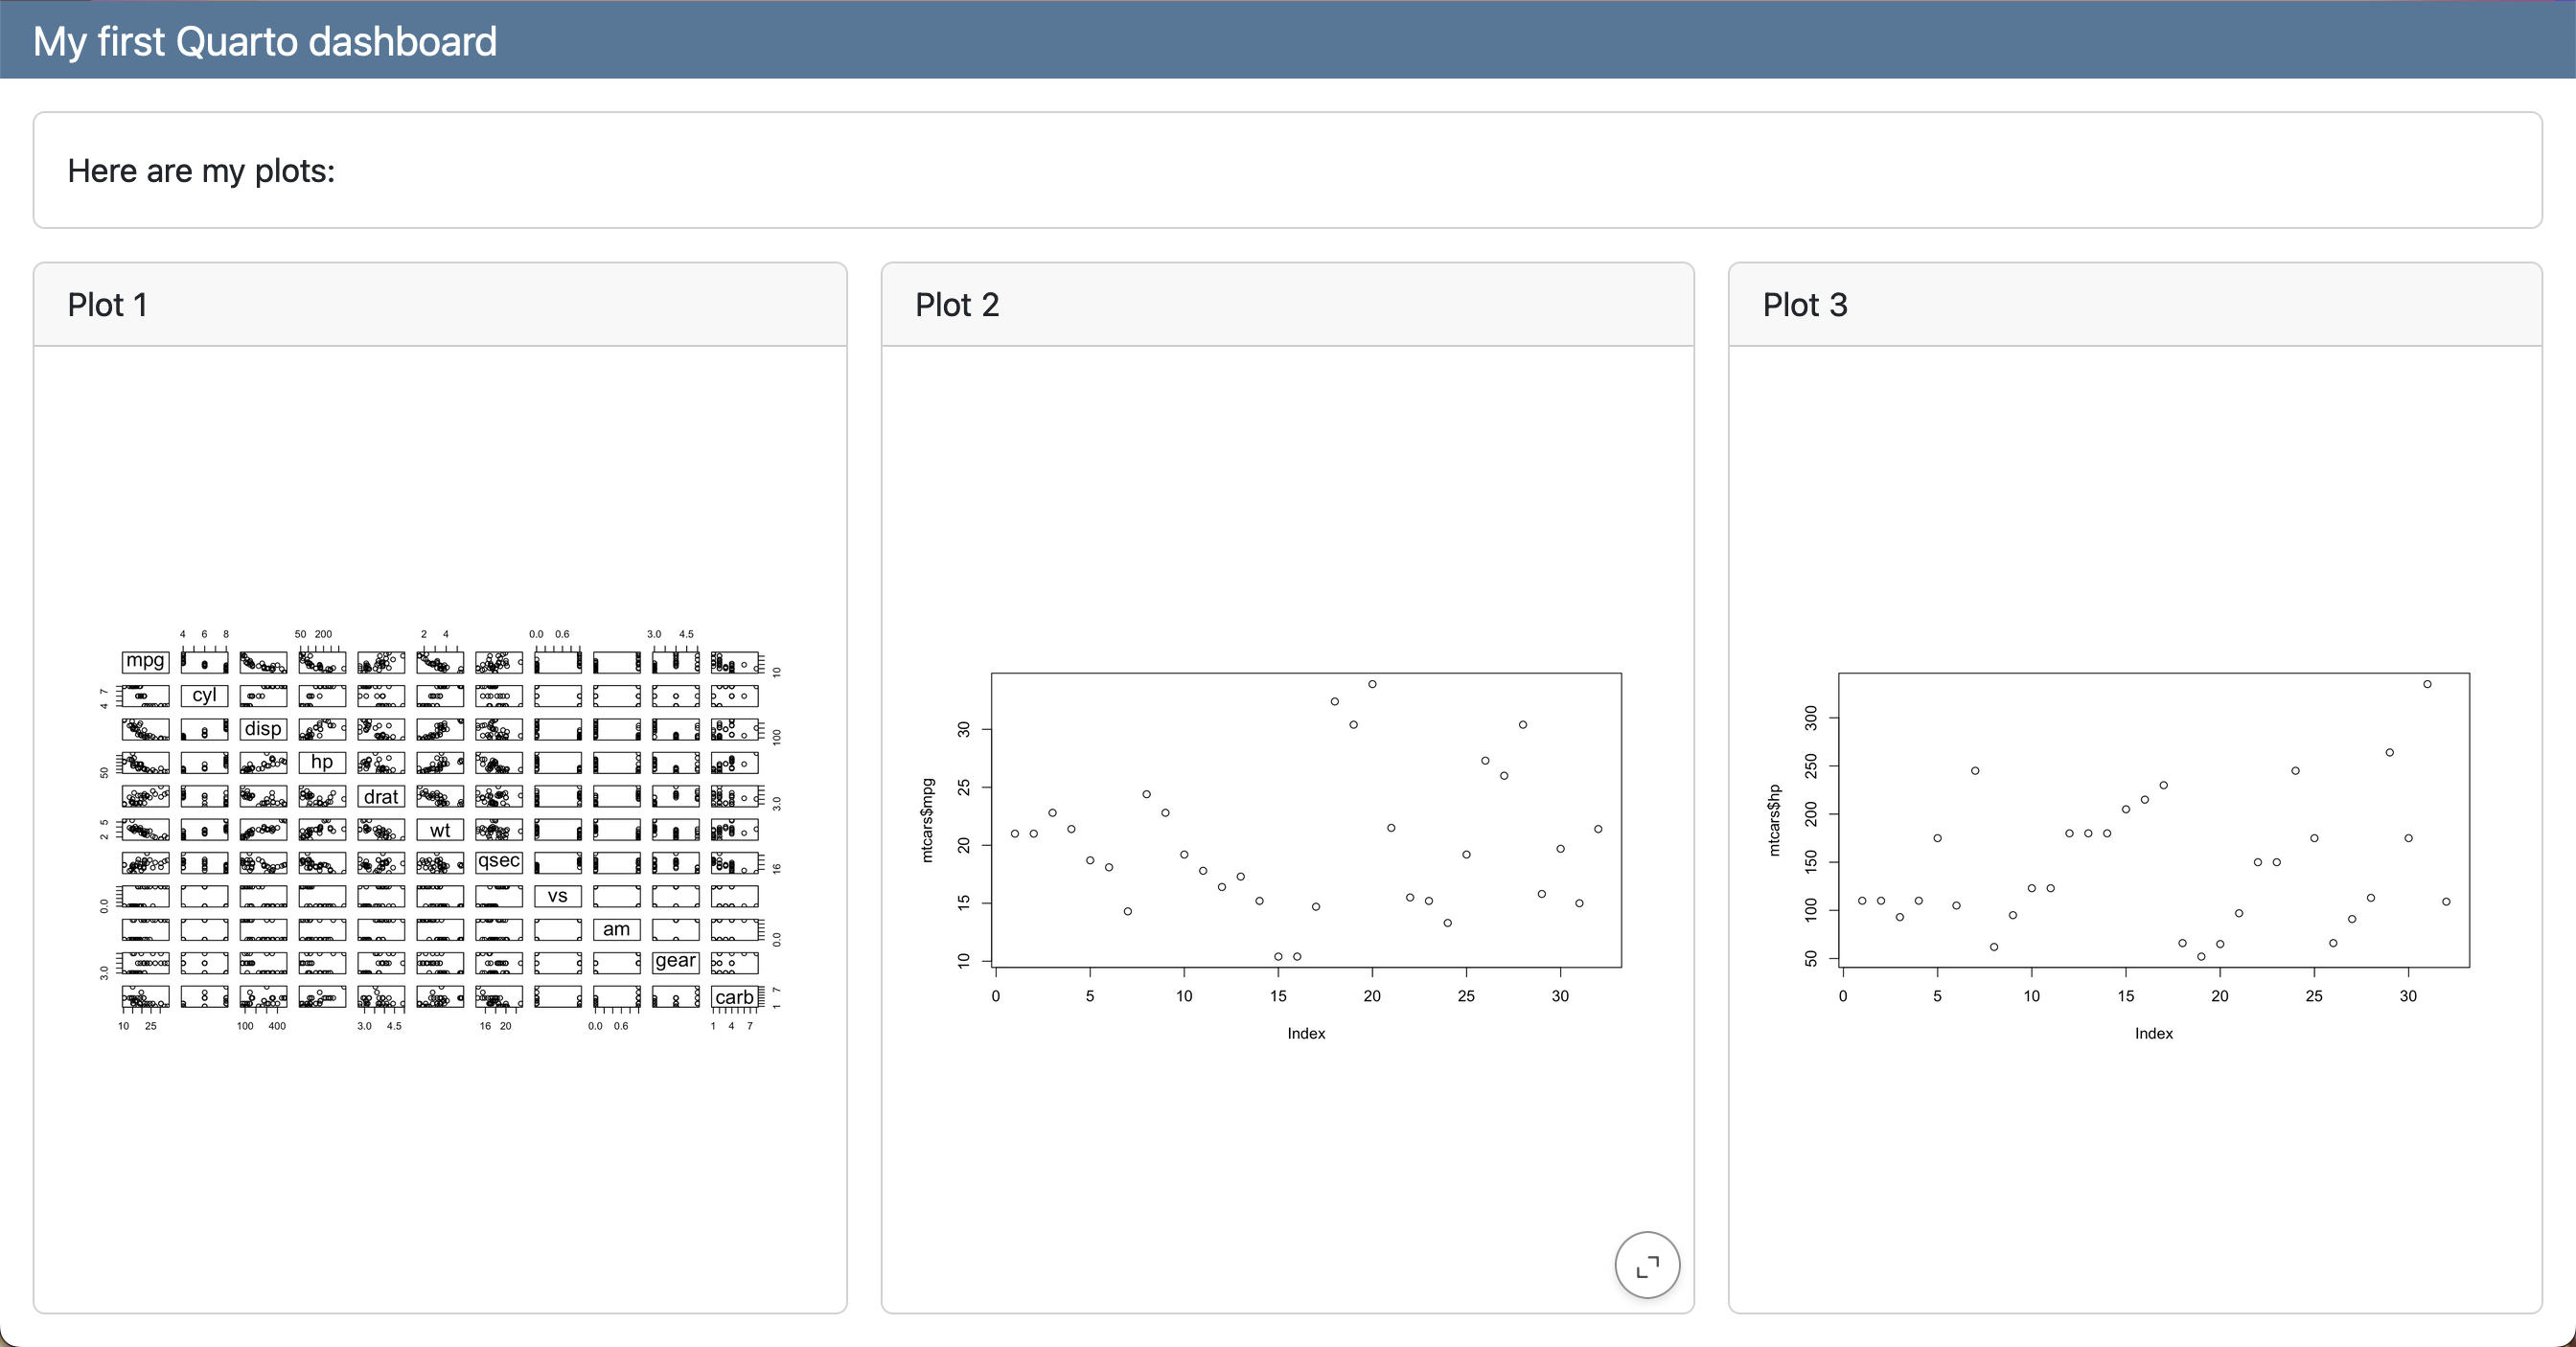
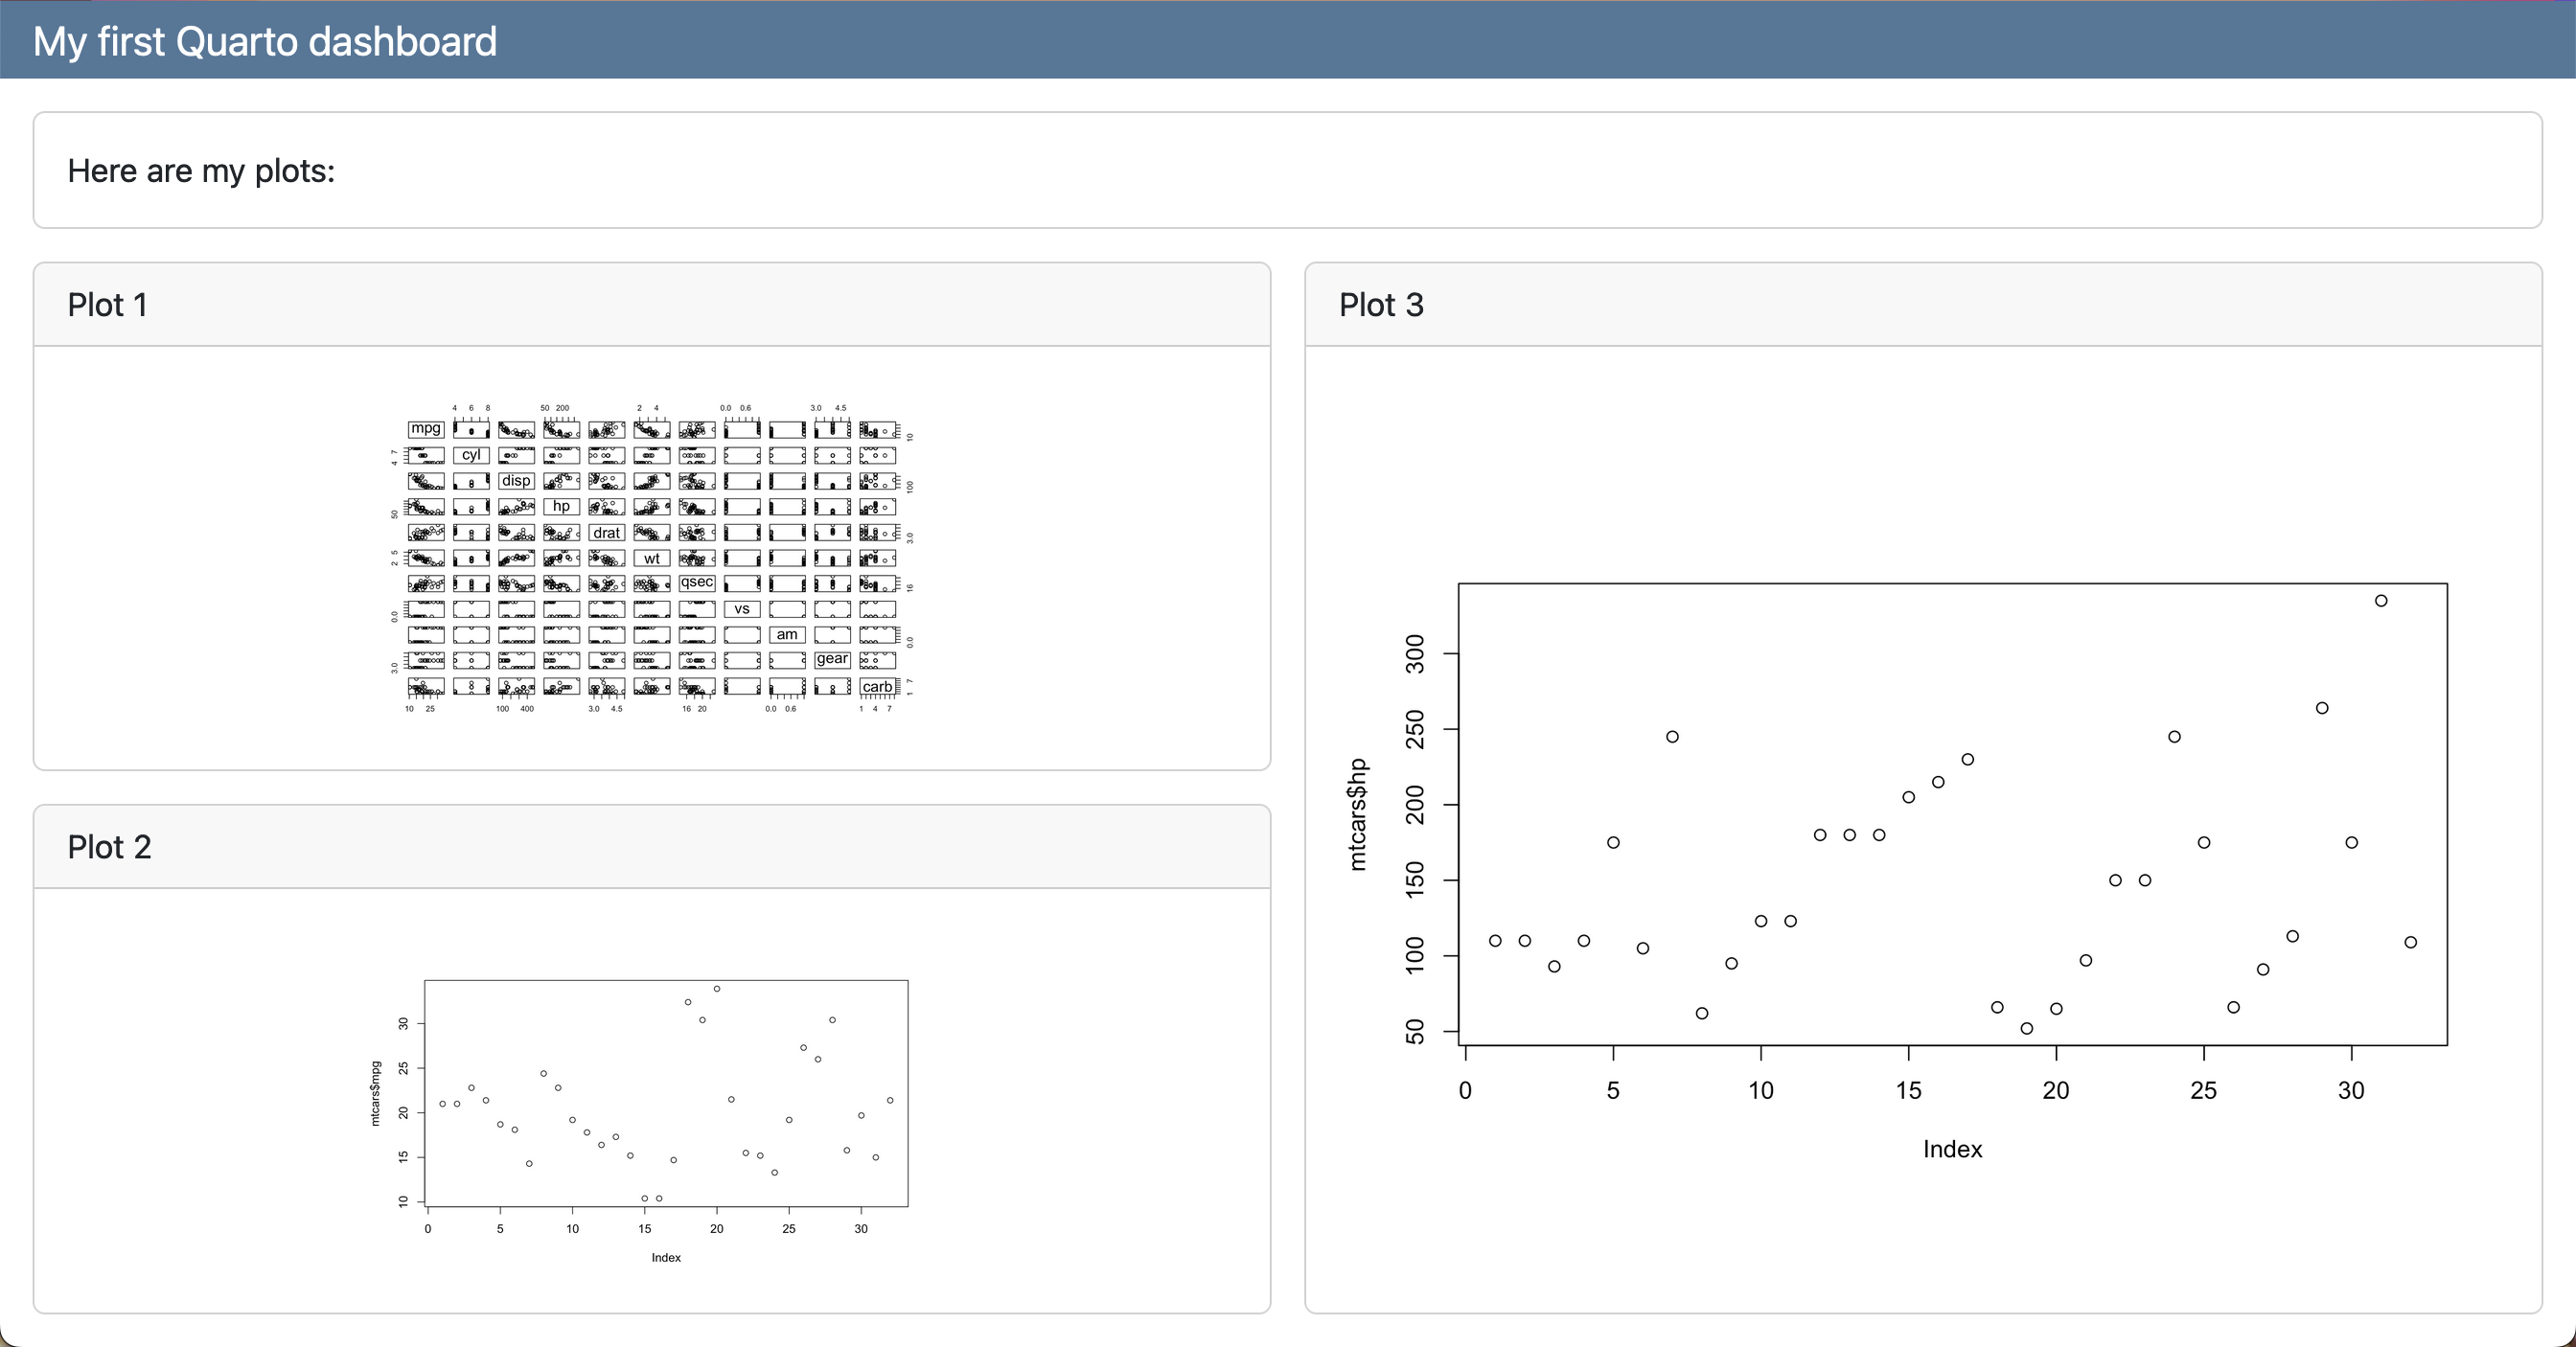
title: "My first Quarto dashboard"
format:
dashboard:
logo: images/car.png
nav-buttons:
- reddit
- icon: gitlab
href: https://gitlab.com/
---
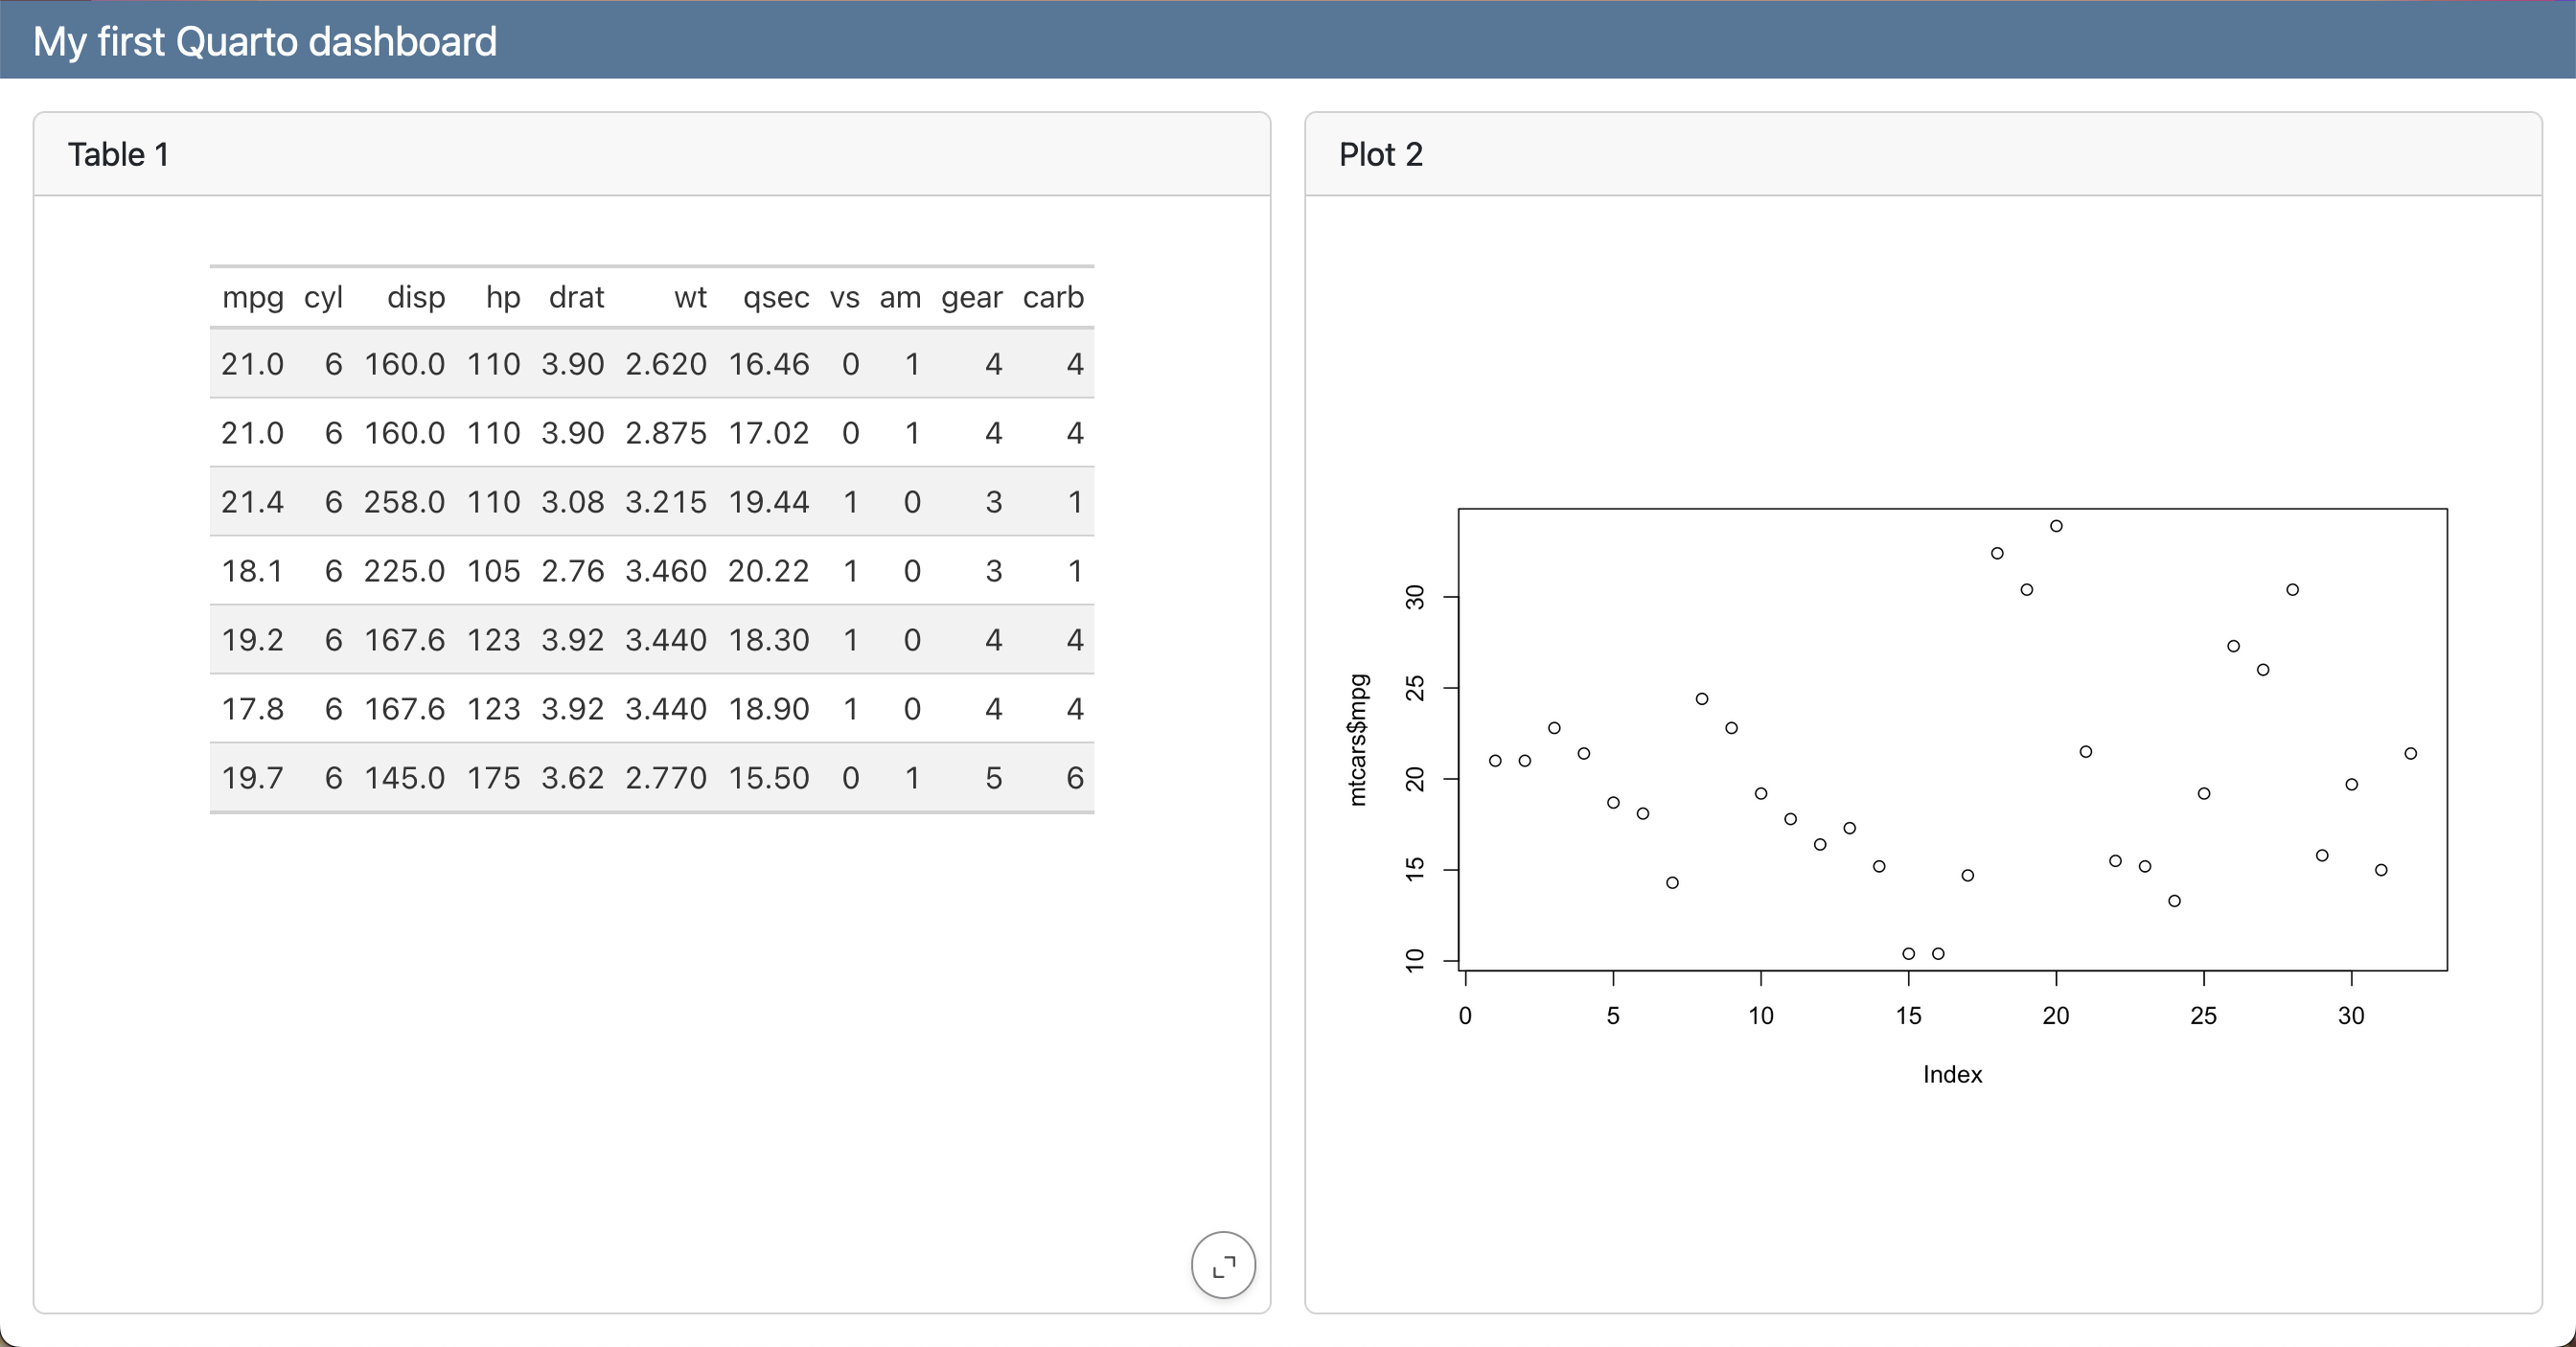
## Row
Here is my dashboard:
# Page 1
```{r}
#| title: "Plot 1"
plot(mtcars)
```
```{r}
#| title: "Plot 2"
plot(mtcars$mpg)
```
# Page 2
```{r}
#| title: "Plot 3"
plot(mtcars$hp)
```
Navigation
See more options: https://quarto.org/docs/reference/projects/websites.html#navbar
Tables
Produce tabular output within cards:
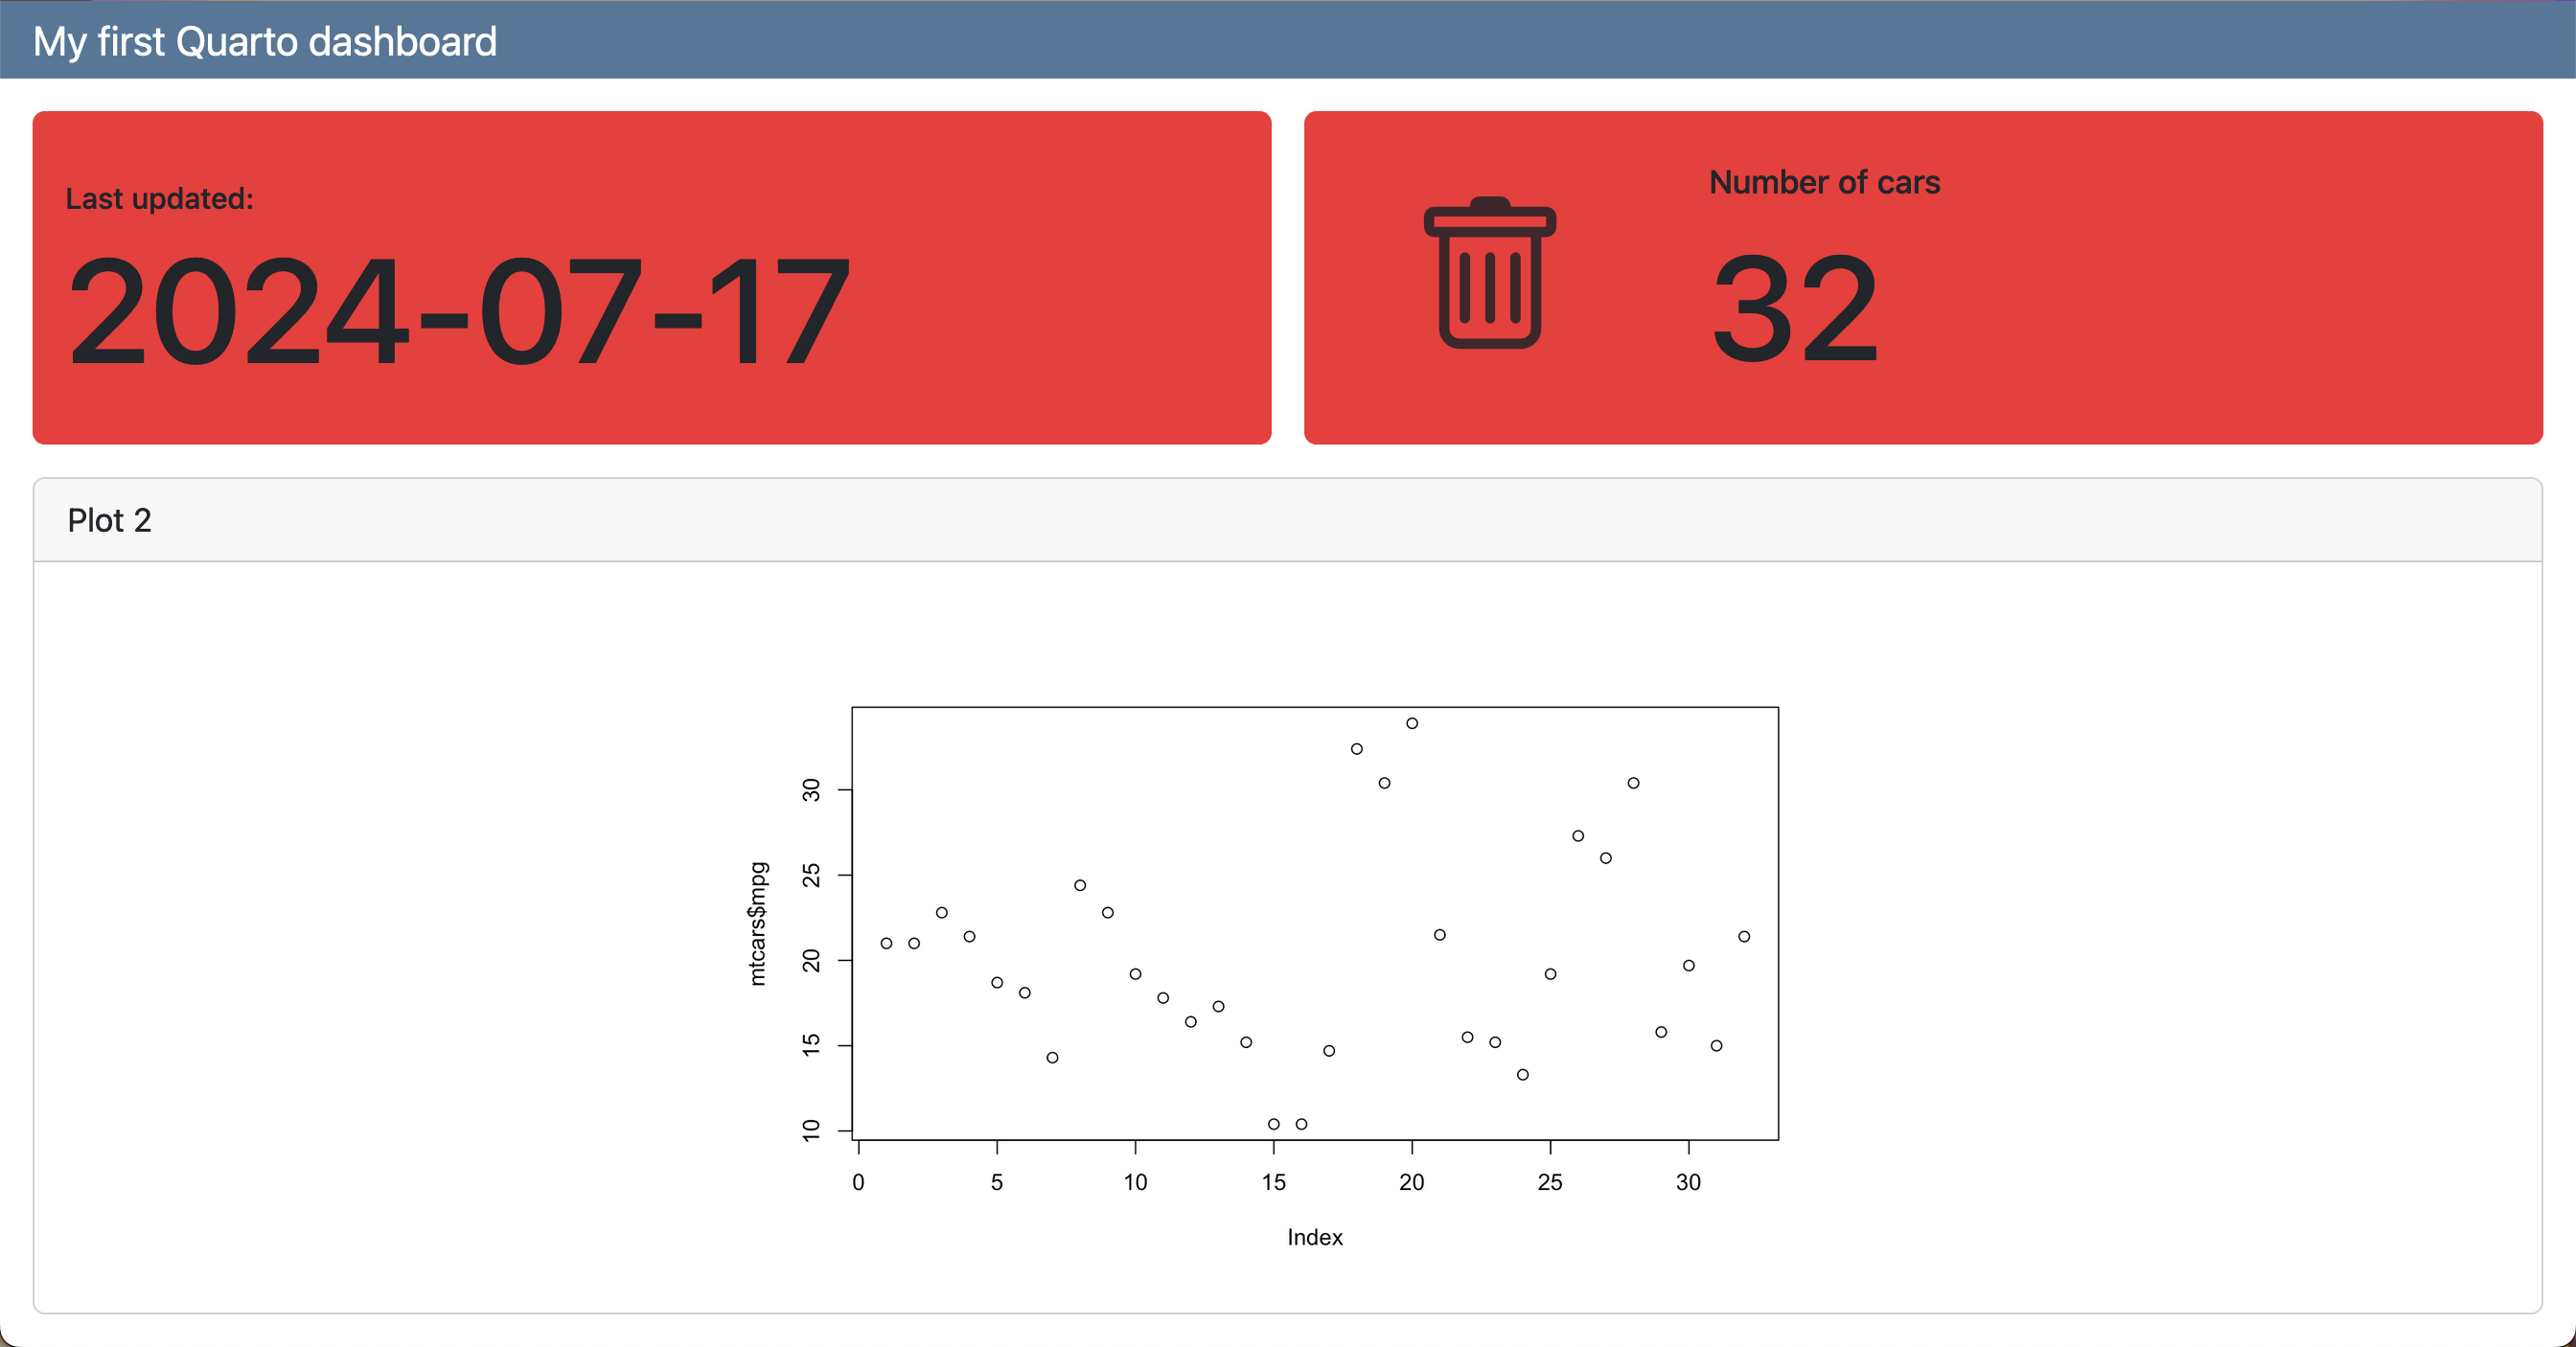
Value Boxes
dashboard.qmd
---
title: "My first Quarto dashboard"
format: dashboard
---
## Row
::: {.valuebox color="#F52A32"}
Last updated:
2024-07-18
:::
```{r}
#| content: valuebox
#| title: "Spam per day"
n <- mtcars |> tibble::as_tibble() |> dplyr::count() |> dplyr::pull(n)
list(
icon = "trash",
color = "#F52A32",
value = n
)
```
## Row
```{r}
#| title: "Plot 2"
plot(mtcars$mpg)
```
Value Boxes
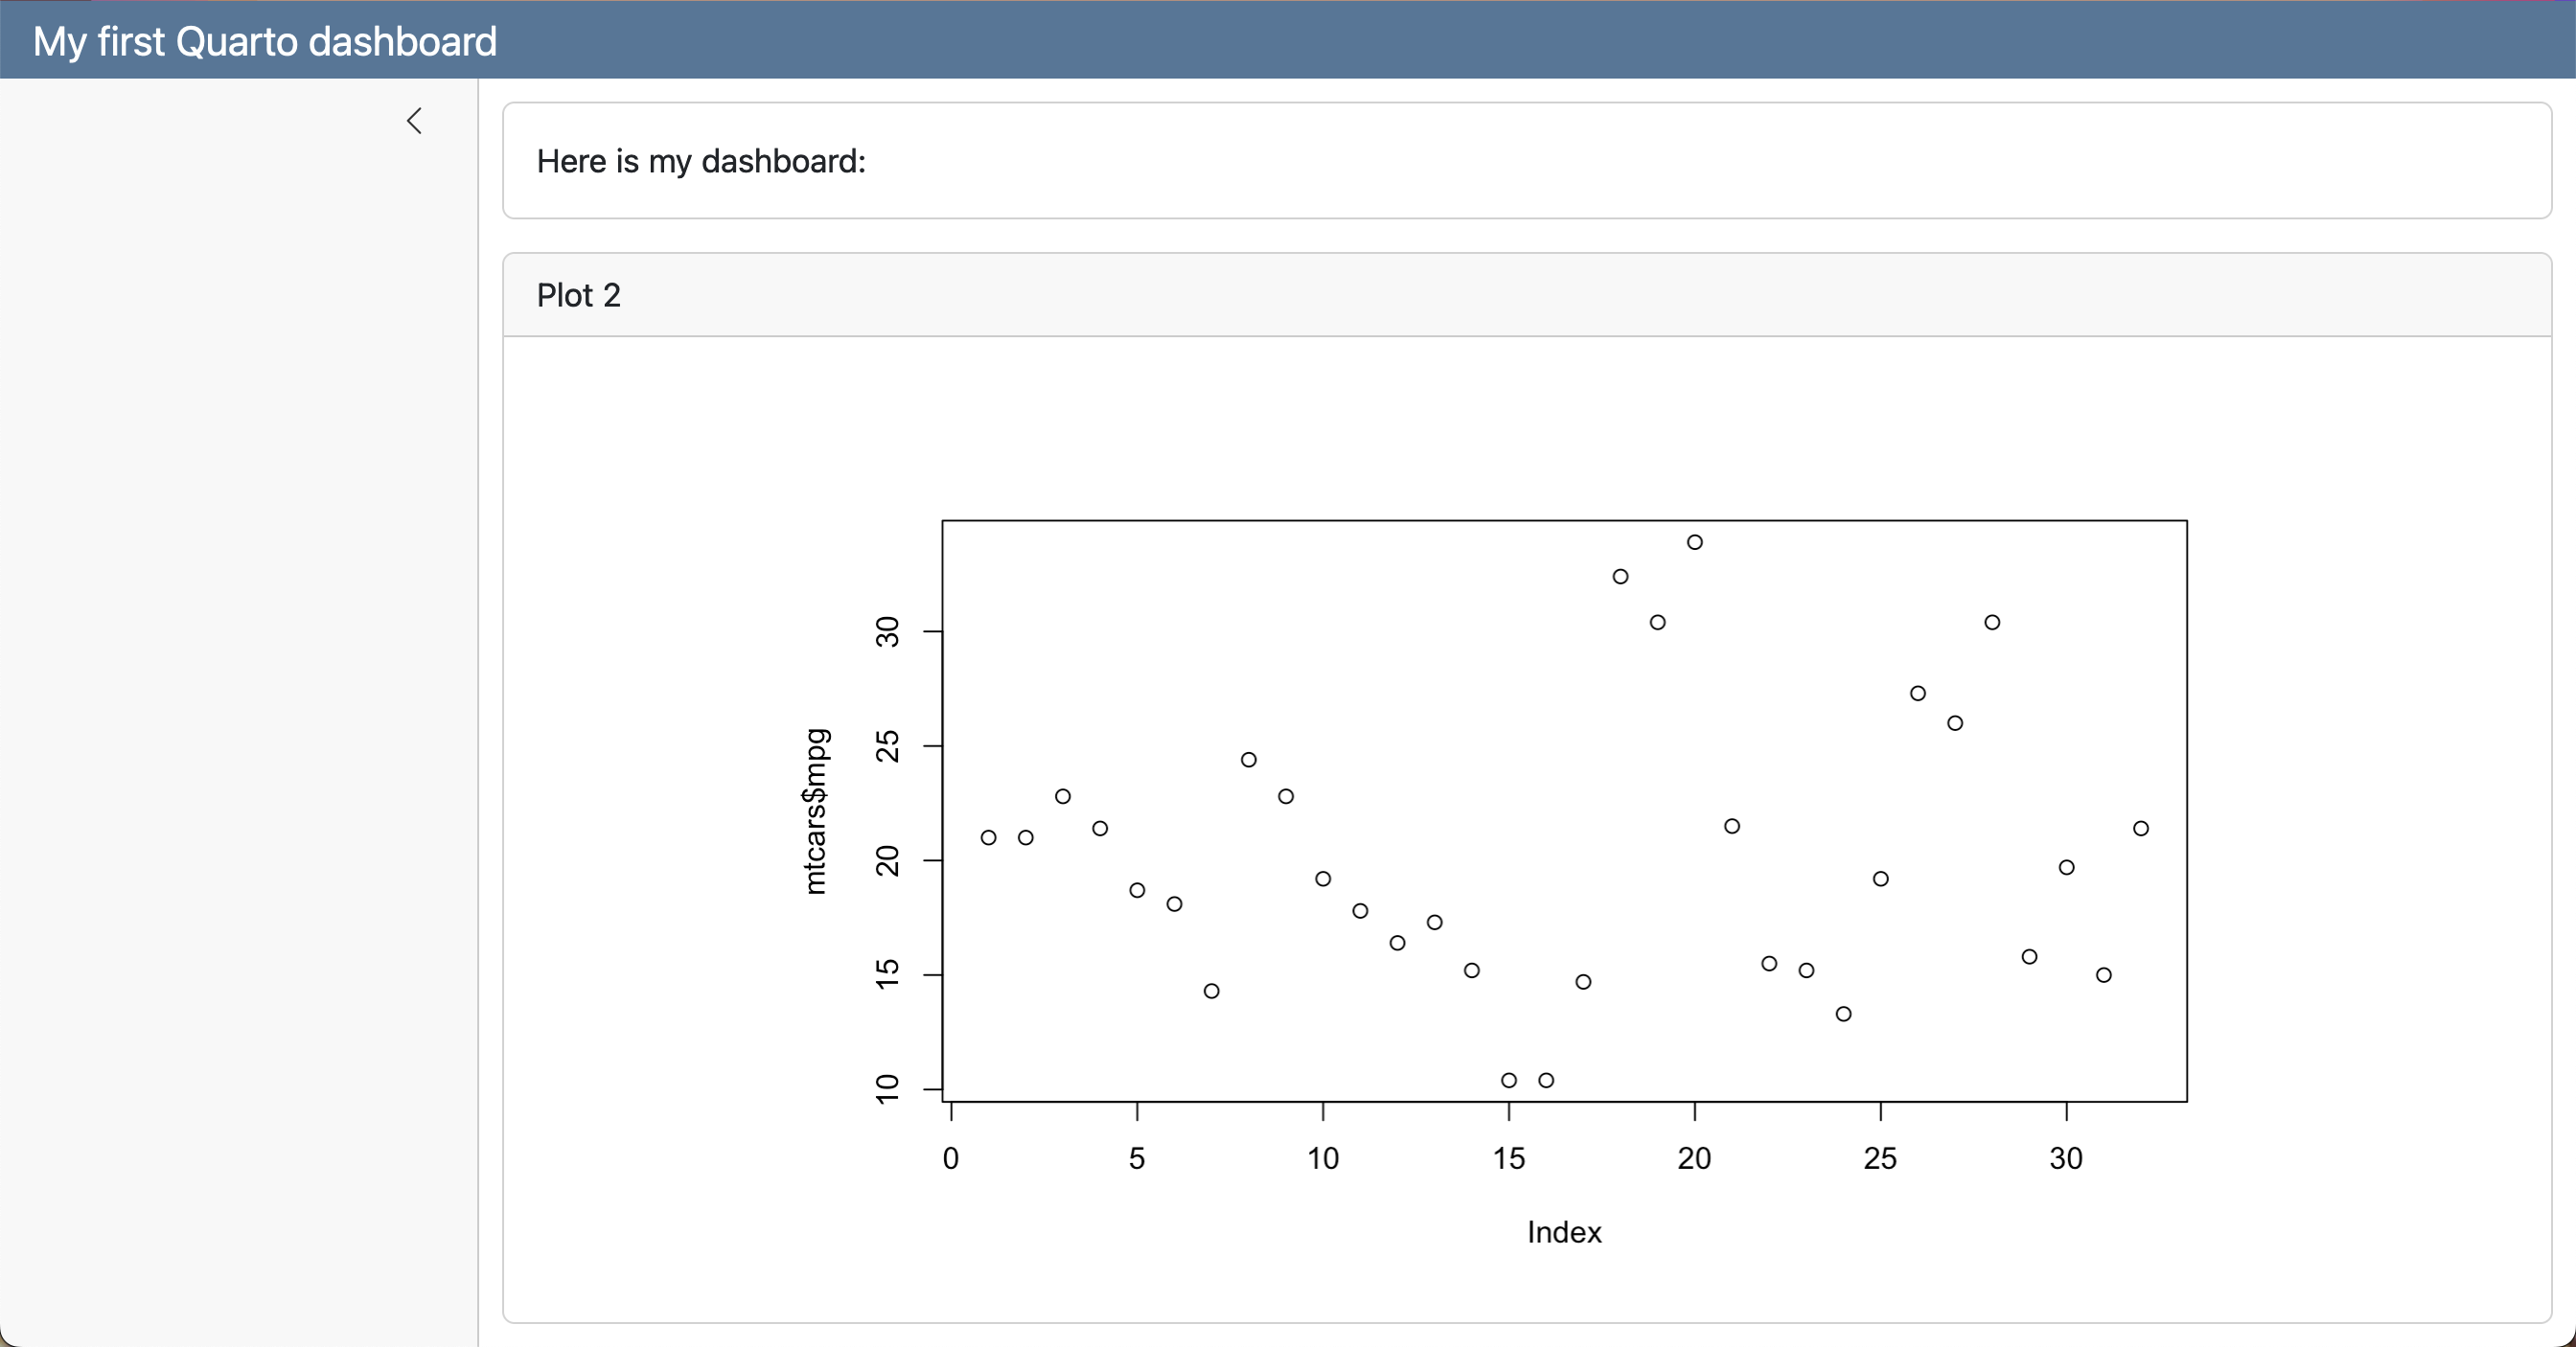
Sidebars
To include a sidebar, add the .sidebar class to a Level 2 heading:
dashboard.qmd
---
title: "My first Quarto dashboard"
format: dashboard
---

## {.sidebar}

Sidebar text here!

## Column

### Row

::: {.valuebox color="#F52A32"}
Last updated:

2024-07-18
:::

```{r}
#| content: valuebox
#| title: "Spam per day"
n <- mtcars |> tibble::as_tibble() |> dplyr::count() |> dplyr::pull(n)

list(
  icon = "trash",
  color = "#F52A32",
  value = n
)
```

### Row

```{r}
#| title: "Plot 2"
plot(mtcars$mpg)
```
Quarto or Shiny?
Why not both?
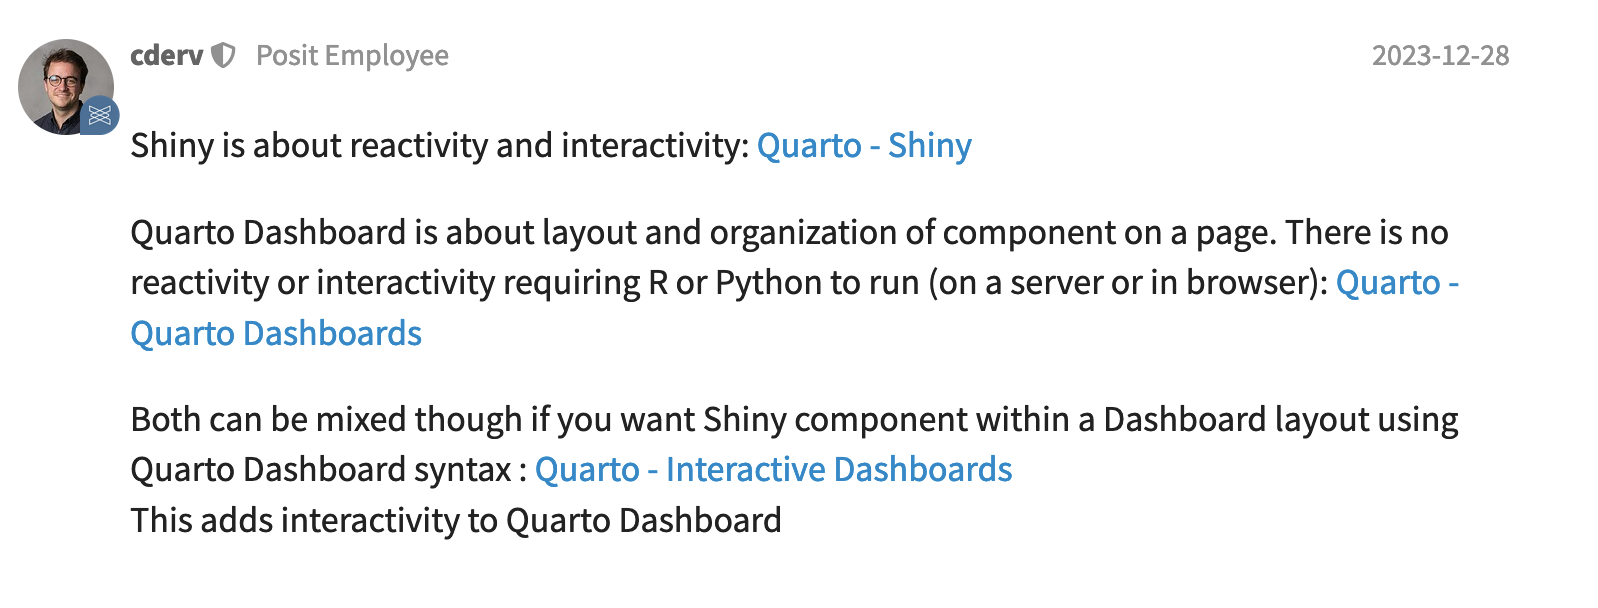
https://forum.posit.co/t/quarto-dashboards-vs-shiny/178402
Non-interactive dashboard
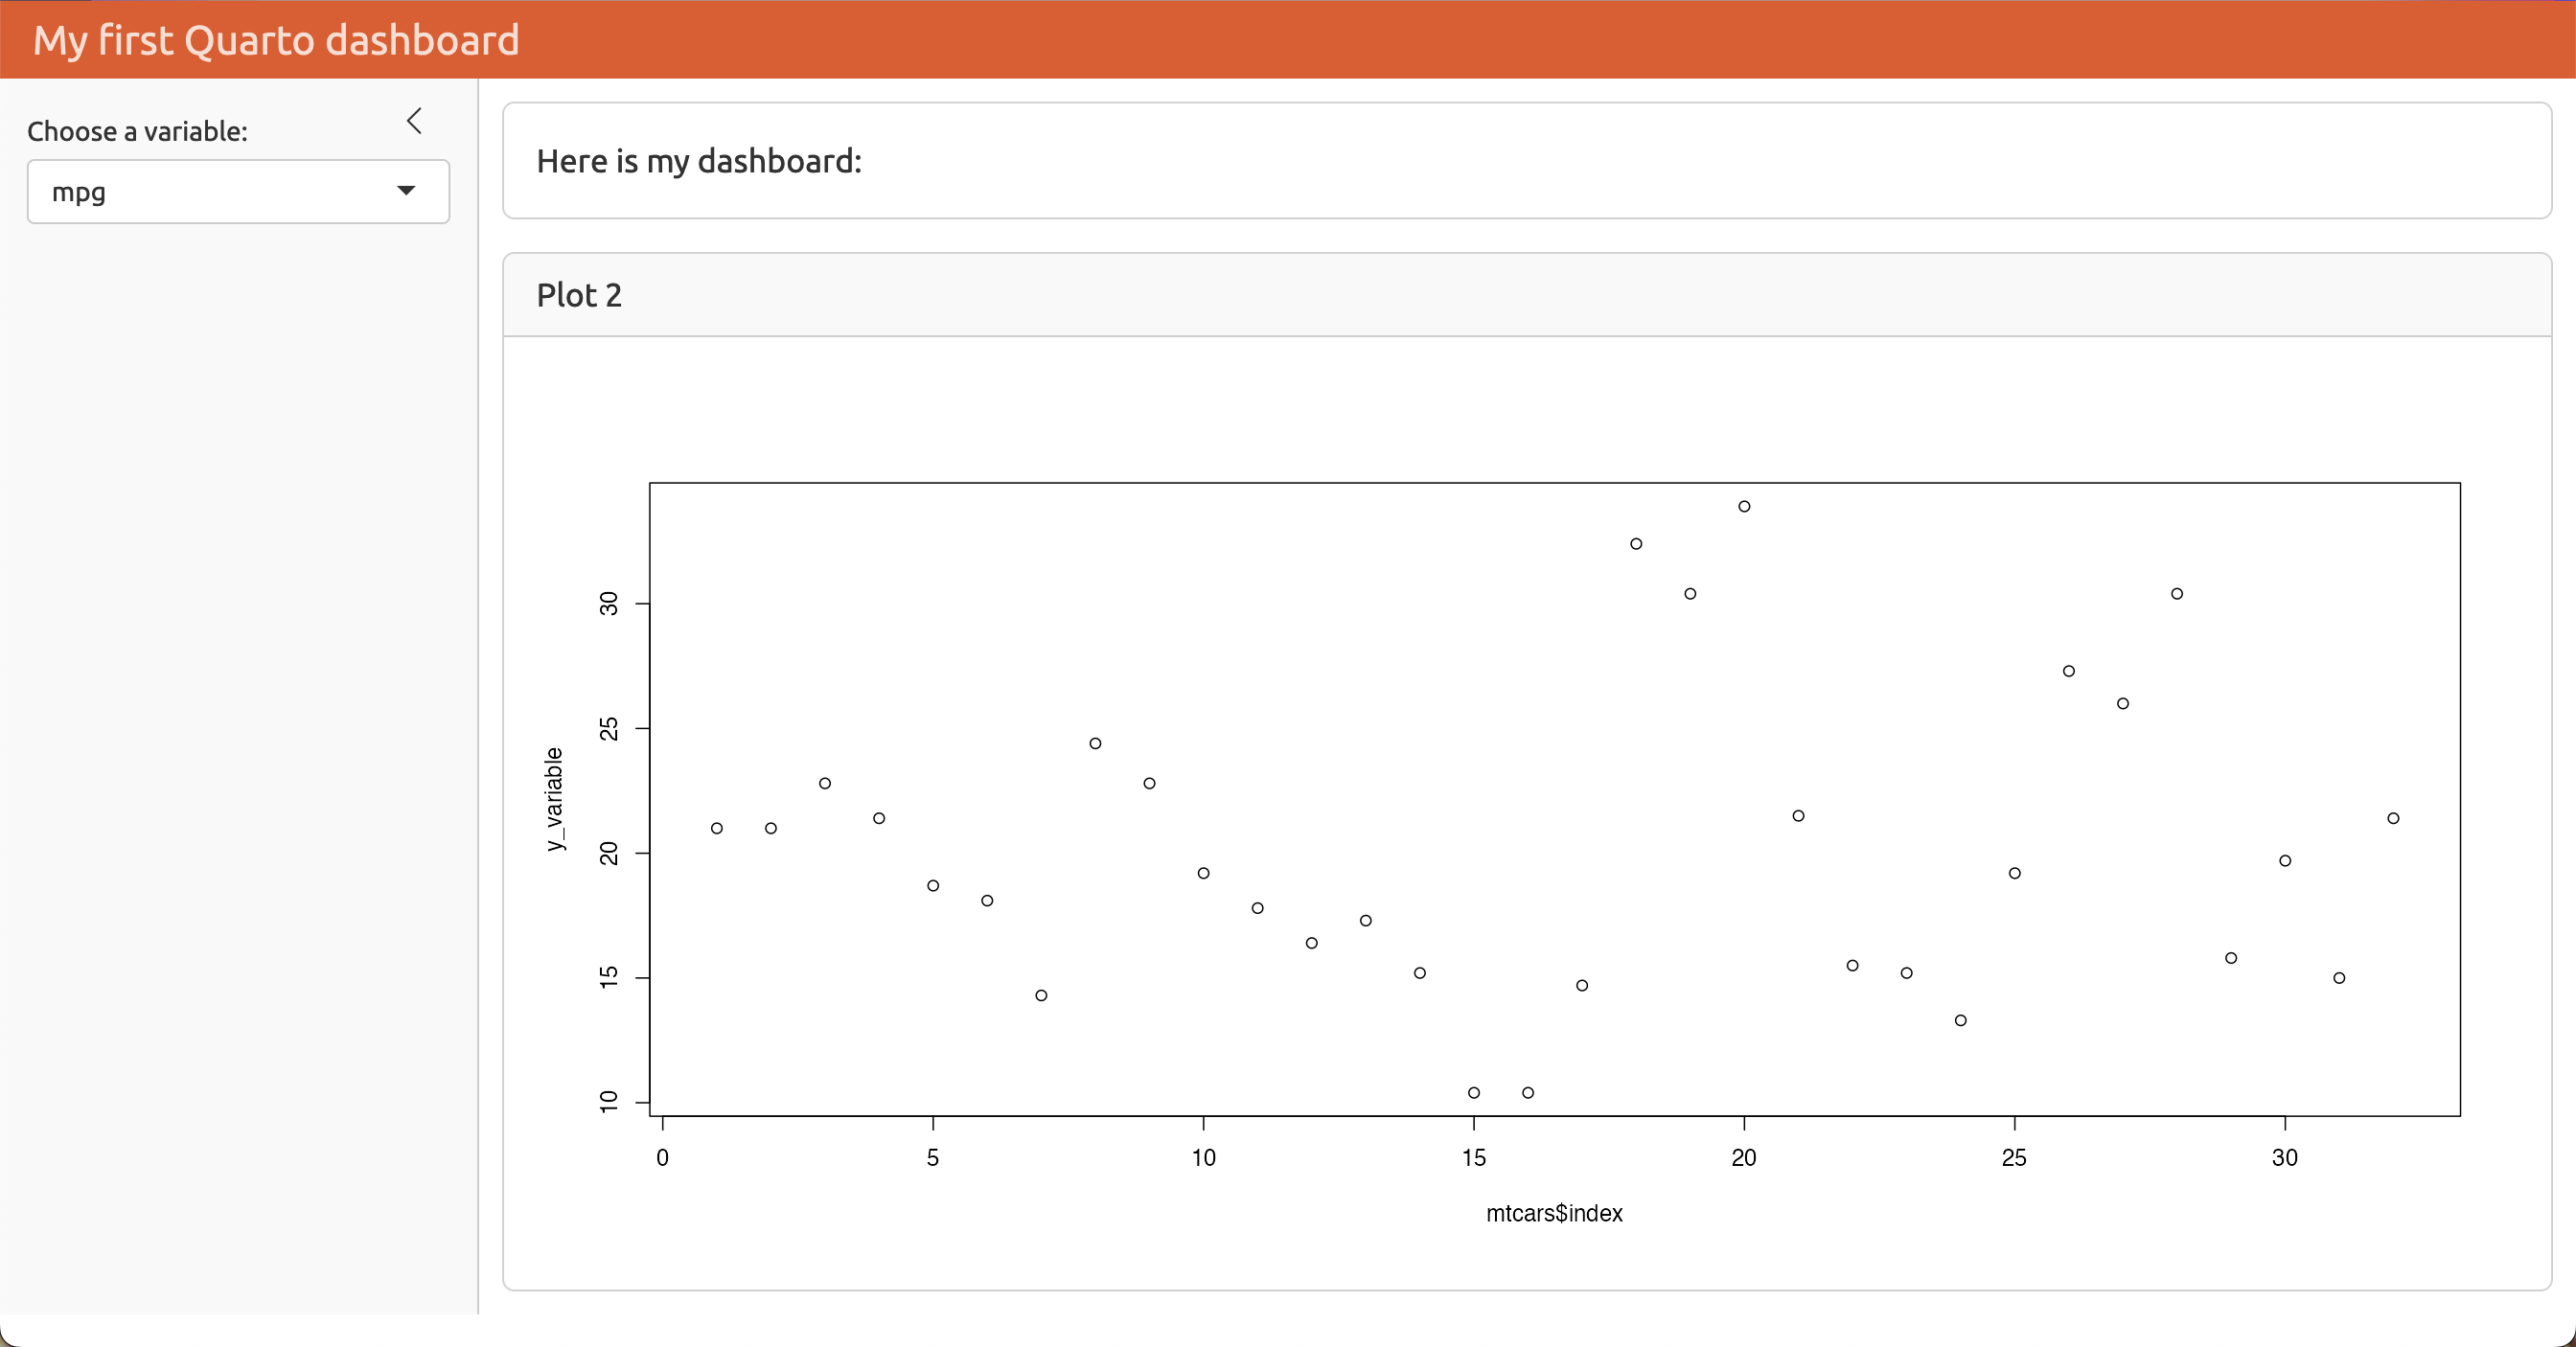
Add Interactive Components
dashboard.qmd
---
title: "My first Quarto dashboard"
format:
  dashboard:
    orientation: rows
server: shiny
---

```{r}
#| context: setup
library(ggplot2)
```

## {.sidebar}

```{r}
selectInput(
    "variableChoice",
    "Choose a variable:",
    choices = names(mtcars)
  )
```

## Column

### Row

Here is my dashboard:

### Row

```{r}
#| title: "Plot 2"
plotOutput("variablePlot")
```

```{r}
#| context: server

output$variablePlot <- renderPlot({
  yVar <- mtcars[[input$variableChoice]]
  plot(mtcars$index, yVar)
})
```
Add Interactive Components
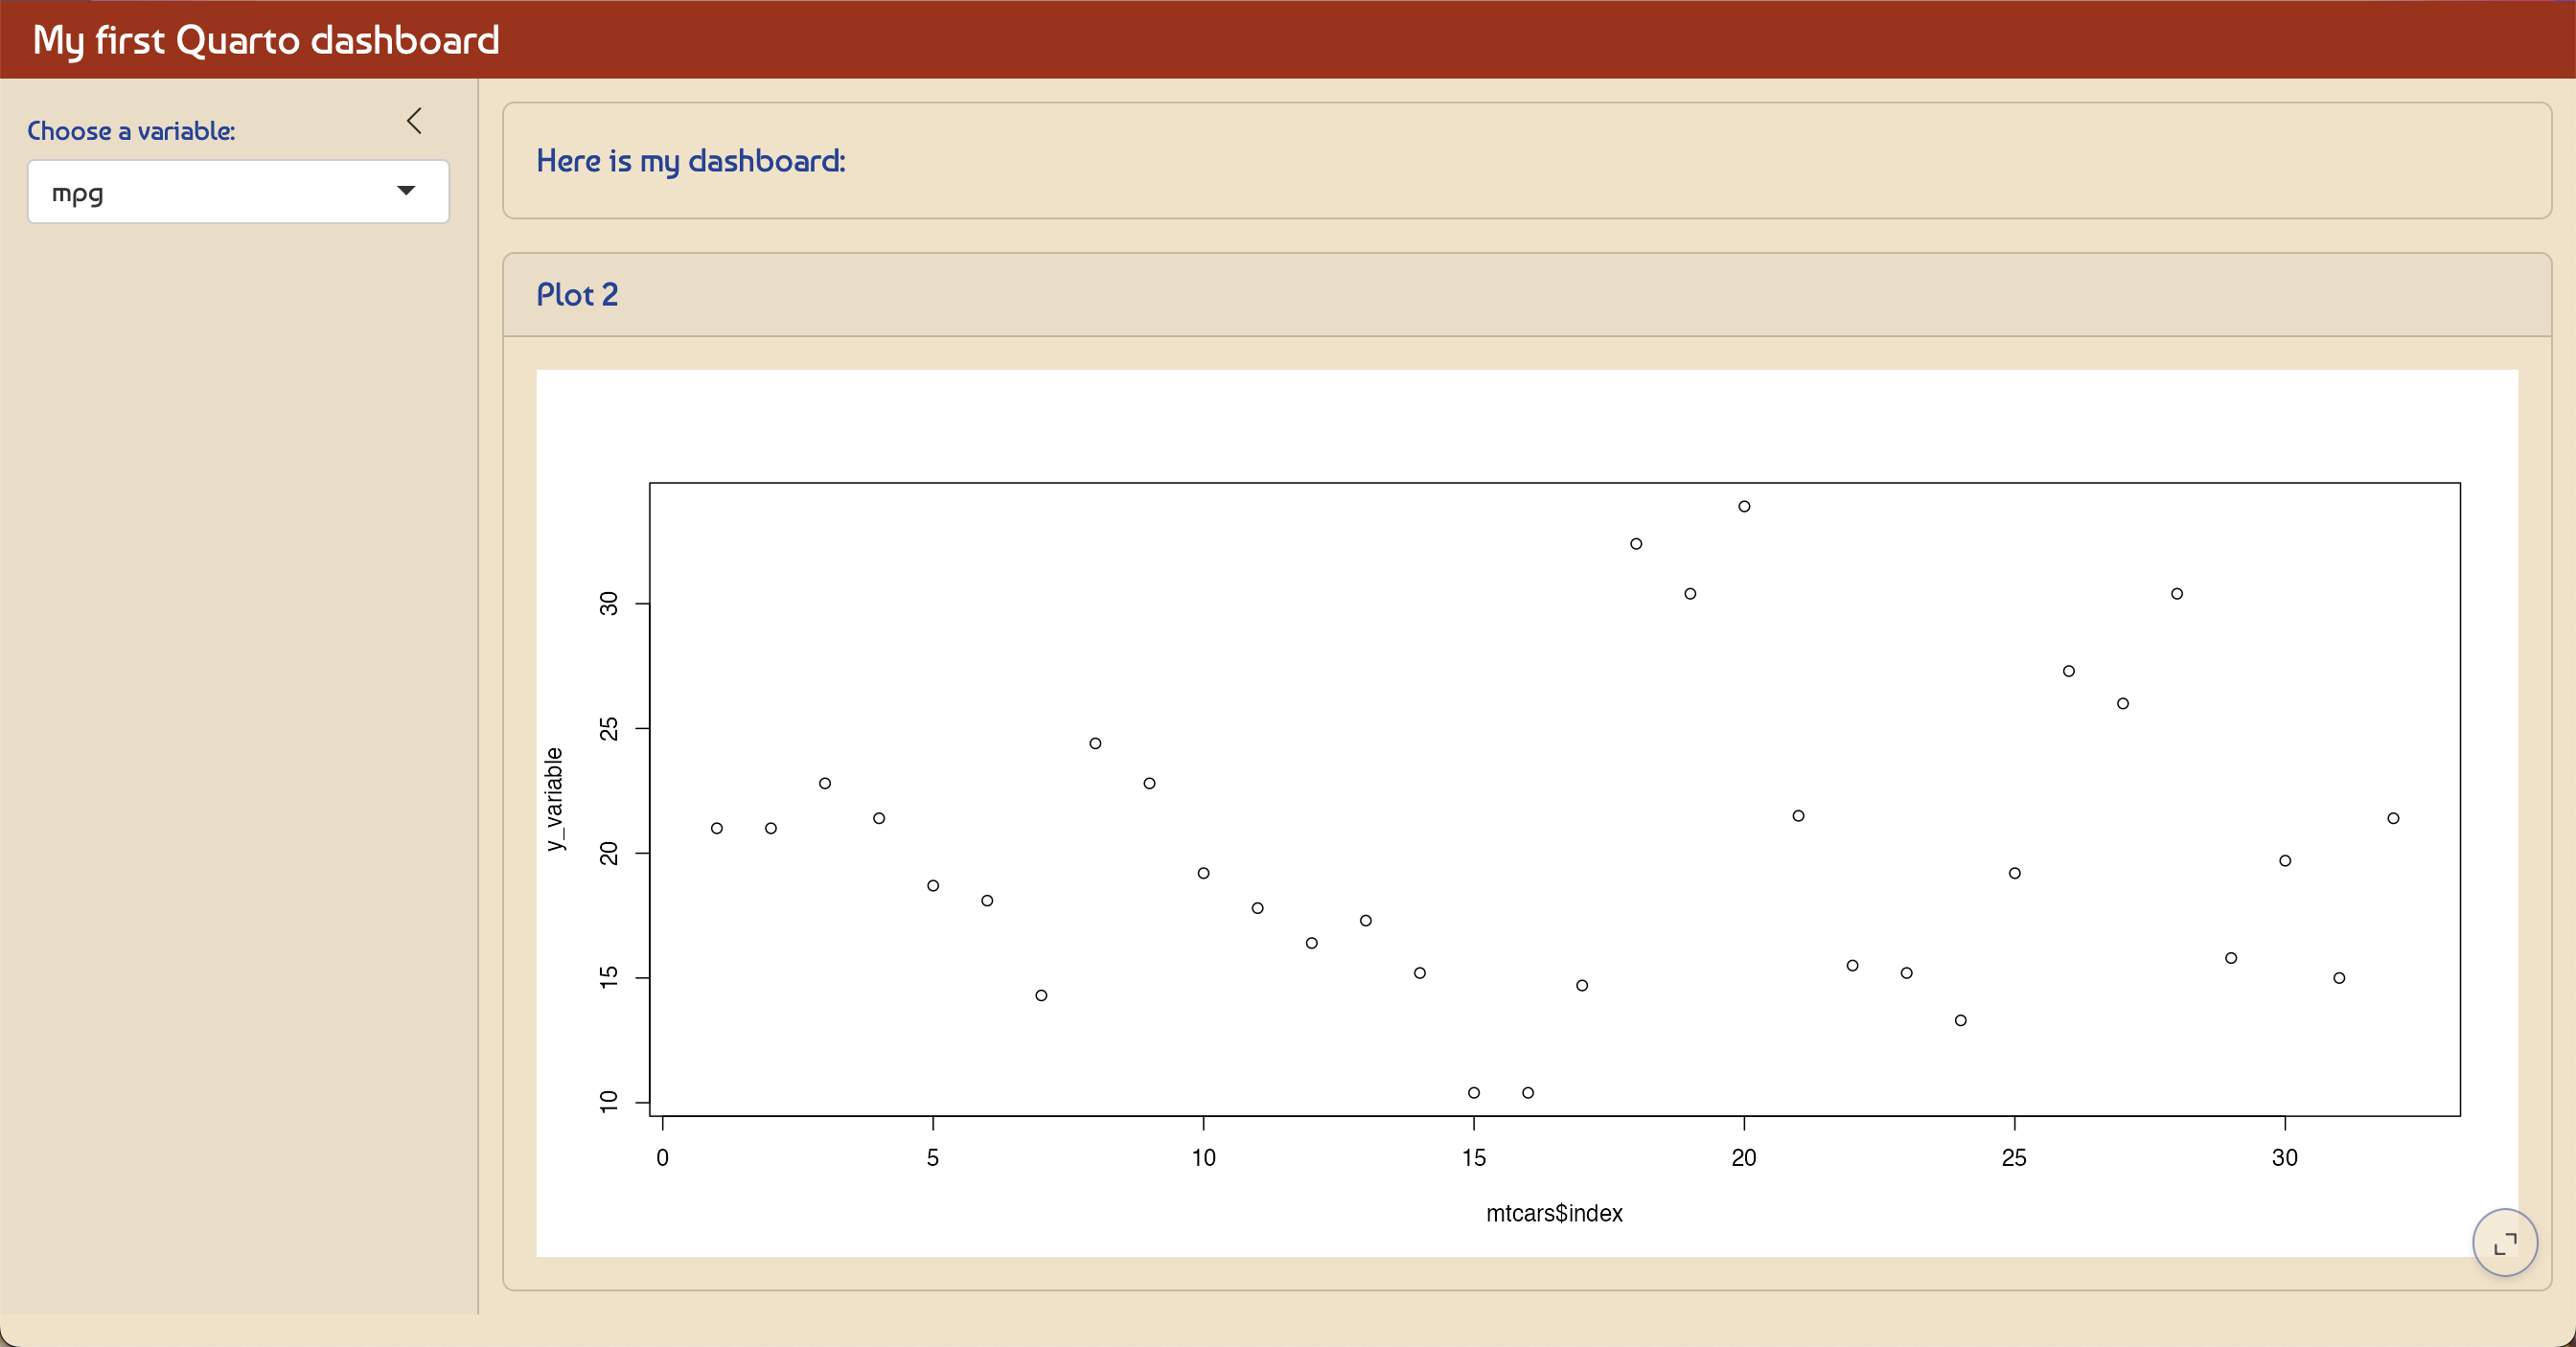
Bootswatch Themes
Quarto includes 25 themes from the Bootswatch project:
dashboard.qmd
---
title: "My first Quarto dashboard"
format:
  dashboard:
    theme: united
server: shiny
---

```{r}
#| context: setup
library(ggplot2)
```

## {.sidebar}

```{r}
selectInput(
    "variableChoice",
    "Choose a variable:",
    choices = names(mtcars)
  )
```

## Column

### Row

Here is my dashboard:

### Row

```{r}
#| title: "Plot 2"
plotOutput("variablePlot")
```

```{r}
#| context: server

output$variablePlot <- renderPlot({
  yVar <- mtcars[[input$variableChoice]]
  plot(mtcars$index, yVar)
})
```
Bootswatch Themes
Custom Themes
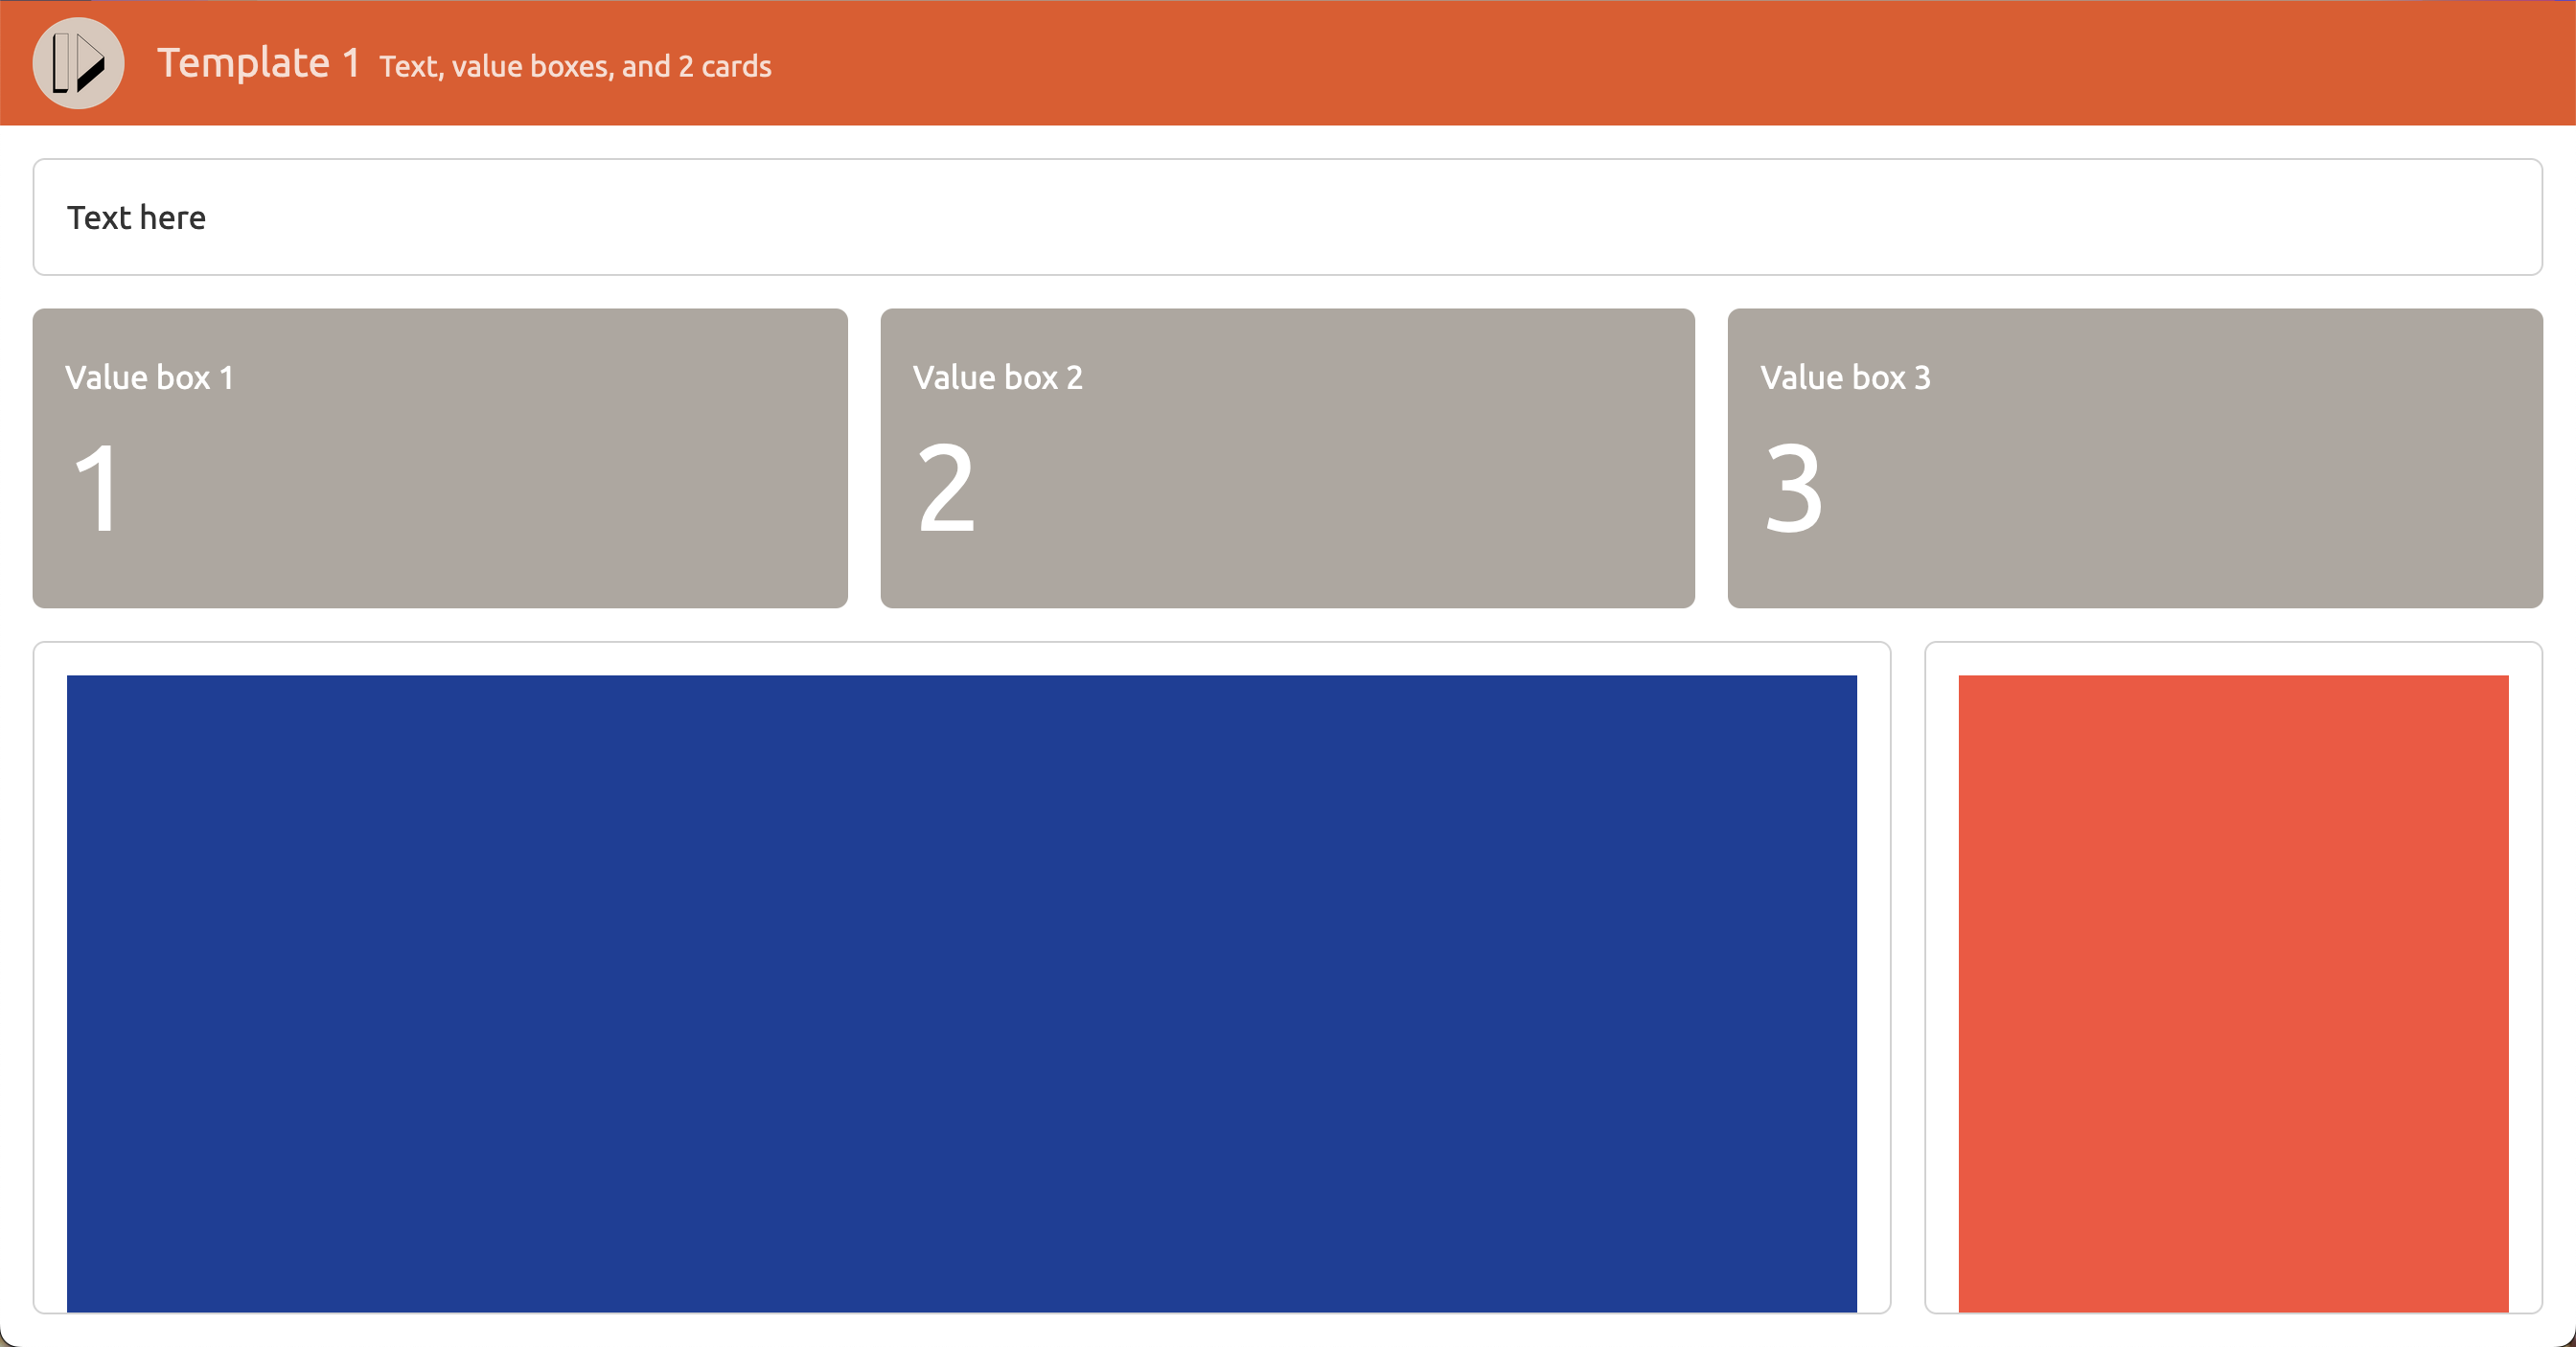
Templates
I added a folder of templates for different dashboard layouts in the GitHub repository:
Thank you!